The Canola Council, in collaboration with PAMI and the provincial canola grower commissions, is gathering information to help define best management practices for summer storage of canola. After comparing three options through the summer of 2014, Joy Agnew, project lead, concluded that:
Based on the results from this study, “leaving it alone” seems to be the best practice to minimize storage risk throughout the summer. However, these results were limited to overdry canola that had been uniformly frozen over the winter and stored in an 18 ft diameter bin. Canola starting at a higher moisture content or a higher temperature or stored in a different sized bin might behave differently during the summer.
Therefore, the key recommendation from this project is to leave the bin alone but monitor the temperature profile and have a plan in place to move the seed if problems arise.
The project continues for 2015.
Here is Joy Agnew’s compete 2014 summary:
The purpose of this project was to collect baseline information on how management practices affect the storage conditions of canola over the summer months. It was hypothesized that ambient conditions would warm up the grain at the edge of the bin and generate convection currents that could result in moisture migration and spoilage.
The in-bin temperature and relative humidity data was logged in three bins starting in June 2014. One bin was left alone as a baseline, one bin had 700 of its 4,000 bushels removed and returned to the same bin (“turned”) and one bin was aerated during the evening to slowly warm up the grain. All three bins contained dry canola (average moisture content = 6.5%) that had been frozen during the previous winter by aerating when the ambient temperature was below -30°C. In fact, the temperature of the core of the bins was still as cold as -17°C when we started monitoring on June 6, 2014.
The key results from the project are:
—There was very little moisture migration in all three bins throughout June and July, therefore, no spoilage or condensation was observed for any treatment. However, lack of moisture migration may have been partially due to the lack of moisture in the canola (the canola moisture content was 6%).
—There were large temperature differences in each bin throughout the summer. The baseline bin temperature was 25°C at the edge and -3°C in the core for most of July.
—There was no noticeable difference in the grain temperature on the sunny side of the bin versus the shady side of the bin. The maximum temperature difference of the canola between the sunny and shady sides was 3°C.
—The temperature in the bin headspace fluctuated widely from day to night (reaching as high as 55°C), but the relative humidity of the air in the headspace was very low (<40%). The temperature of the grain at the top of the bin (within 2 ft of headspace) did not fluctuate from day to night, illustrating the great insulating effect of canola. —Turning the seed (700 bushels in a 4,000 bushel bin) did help to improve the uniformity of seed temperature. However, the funneling effect of pulling out only a portion of the seed initially resulted in a relatively warm core and warm edges but cool seed between the core and edges. This temperature differential eventually evened out as the core of the turned bin cooled throughout June and July (from 6°C after turning to -3°C in late-July), then slowly warmed to 8°C by mid-October. —Aerating the seed resulted in a uniform temperature distribution (approximately 20°C), but the transition between the warming front and the cool seed during aeration resulted in some unstable conditions (potential for condensation). —Aerating the seed (using warm, summer air) added a large quantity of water to the air voids in the bin (as measured by absolute humidity). However, this moisture was not transferred to the seed since the moisture content of the canola did not change (6.6% at the start of monitoring and 6.5% three weeks after aeration was completed). This result was also observed during the bench scale testing since the moisture content of the dry canola did not increase after aerating with air that had a high equilibrium moisture content (as high as 12%) for several days. This indicates that rewetting canola using aeration may not be practical. —The turned bin and aerated bin had some unstable conditions in July that could possibly have resulted in spoilage. Unstable conditions resulted in warm seed being directly adjacent to cool seed. In the aerated bin, these conditions occurred as the warming front moved through the cool seed. In the turned bin, these conditions occurred because the warm seed at the top funneled down into the center of the bin during turning, leaving a warm core adjacent to cool seed. However, these unstable conditions did not result in noticeable condensation or spoilage. The baseline bin had a large temperature differential (28°C), but the temperature difference was gradual, resulting in generally stable conditions —The warming rate of canola is approximately equal to the cooling rate when using aeration flowrates (0.1 to 0.5 cfm/bu). In the 4,000 bu bin, it took approximately 48 hours of fan operation to uniformly warm the seed using 0.75 cfm/bu (the lowest flowrate possible with the fan on the bin). In the small test bins, it took 90 hours to uniformly warm canola from -10°C to 20°C using 0.25 cfm/bu and 75 hours to uniformly warm canola from -10°C to 20°C using 0.5 cfm/bu. Based on the results from this study, “leaving it alone” seems to be the best practice to minimize storage risk throughout the summer. However, these results were limited to overdry canola that had been uniformly frozen over the winter and stored in an 18 ft diameter bin. Canola starting at a higher moisture content or a higher temperature or stored in a different sized bin might behave differently during the summer. Therefore, the key recommendation from this project is to leave the bin alone but monitor the temperature profile and have a plan in place to move the seed if problems arise. Problems may be minimized by starting with very cold seed in the spring and keeping it as cool as possible for as long as possible (no aeration or turning). Aerating grain with very cold temperatures should be done with caution, however, as moisture will be removed from the grain which can result in condensation in the headspace of the bin which will freeze and restrict airflow. Freezing of grain should be done in stages (target a temperature drop of 10°C at a time) and ensure you have sufficient venting area in the headspace to allow moist air to escape. If canola is stored in a non-aerated bin throughout the summer (or for any period greater than a few months), it is extremely critical to monitor the temperature. Even if it was dry when loaded, consider turning it (ideally the entire bin) every few weeks or every month to minimize risk of heating and damage. PAMI thanks the Canola Council of Canada and the provincial canola grower associations in Alberta, Saskatchewan and Manitoba for providing funding for this project. Special thanks to Angela Brackenreed and Jay Whetter for their enthusiasm and support throughout the project and to Lung Brothers’ Partnership for their collaboration and patience during the summer and fall.
The 2014 project blog, from the start
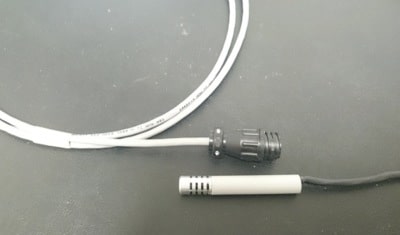
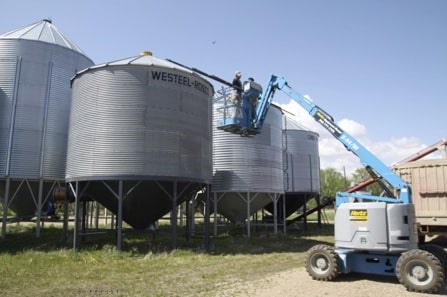
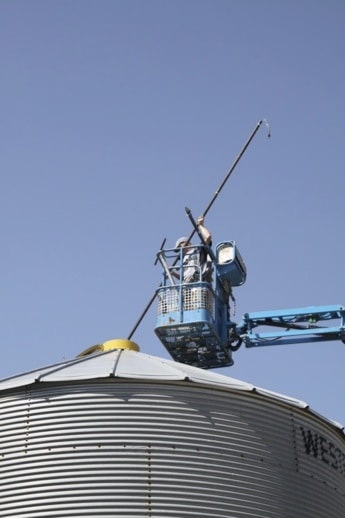
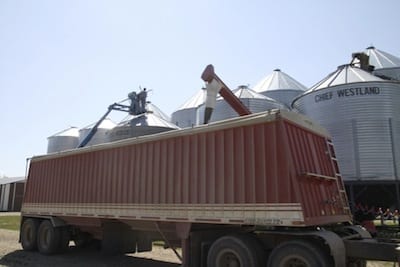
In May 2014, the Canola Council secured funding for a project to help answer these questions. PAMI is working with a partner producer near Lake Lenore, Saskatchewan to monitor the in-grain temperature and relative humidity of three bins full of canola over the summer months. In all bins, the canola was frozen over the winter by running the aeration fans on days that were colder than -30°C. The sensors were installed in early June 2014 without disturbing the grain. This was achieved by inserting long probes into the grain. Temperature and RH sensors were embedded in the bottom of the probe and the wiring was fed up through the center of the probe
August 22 update
The canola in bin 21 was planned to be moved out the week of July 28. Because the majority of the canola was over-dry and under-weight, the producer needed to pull from bin 22 as well to satisfy his contract, so the sensors were removed from both bin 21 (the aerated bin) and bin 22 (the baseline bin). We are continuing to monitor the in-grain temperature and relative humidity in bin 20 (the turned bin). WE ARE NO LONGER MONITORING BINS 21 AND 22.
Note that bin 20 (the turned bin) had reached equilibrium and was behaving similar to bin 22 (the baseline bin) at the end of July.
The most recent screencap before the sensors were removed is here (unreasonable values due to sensor failures are blocked from view):

The core of bin 22 (the baseline bin) was still frozen when monitoring stopped. The temperature and RH data showed some potential problem spots in bin 21 (the aerated bin), but there was no evidence of crusting or heating when it was unloaded on July 30. Moisture content samples were collected throughout unloading and the average moisture content was 6.5%. The starting moisture content (using a sample collected from the top of bin 21) was 6.6%. So there did not appear to be any change in the moisture content or condition of the grain in bin 21 throughout the summer. This is very surprising given this bin was aerated with warm and relatively moist air and the average absolute humidity value increased by 9.9 g/m3 (see previous blog post).
We are continuing to monitor the grain in bin 20 (the turned bin) throughout the rest of the summer to see how the continued warm weather affects the temperature and temperature distribution in the bin. Screencaps of bin 20 from Aug 13, Aug 18 and Aug 22 are shown below.

The temperature of the grain at the edges of the bin is slowly increasing (except at the bottom edges, which appears to be cooling slightly), likely due to its proximity to the wall and ambient temperatures. Unfortunately, the sensor in the middle of the bin is no longer functioning, so we cannot determine the core temperature profile. But the temperature in the centre bottom has increased slightly (likely due to its proximity to the ducting connected to the fan—even though the fan is covered). The temperature in the centre top is stable.
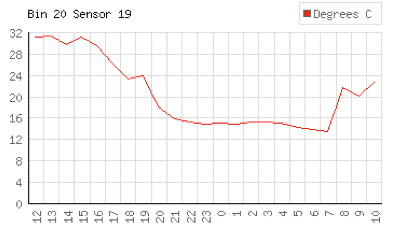
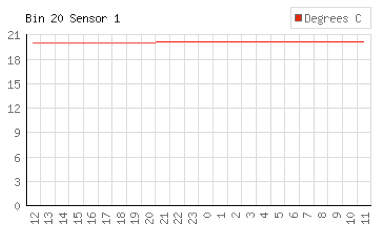
The relative stability of the temperature of the grain at the top of the bin is surprising, given the high temperatures in the headspace. The headspace temperature (°C) routinely hit the mid-40’s in early August, yet the temperature of the grain at the top of the bin remained relatively stable. The sensors at the top of the bin are within 2 ft of the surface, yet we do not see a distinct warming effect due to the insulating value of the grain. The temperature trends over a 24 hour period for the headspace and top of the grain are shown in the following two graphs.
This insulating effect is well known by producers who routinely report that, when the grain was frozen over the winter, the centre is often still frozen when they unload the following summer.
The preliminary findings of this study show that if the grain is very dry and frozen over the winter, it can be safely stored in a 4,000-bu bin through the summer months without any management. In this study, both turning and aerating the grain helped to equalize the temperature distribution within the grain, but these practices also resulted in some unstable conditions (and grain temperatures above 20°C) that could have led to spoilage. Fortunately, both of these “treatments” resulted in stable storage conditions eventually (and no evidence of grain spoilage or damage), but it was “touch and go” for a few days. The baseline bin was stable throughout the summer even though there was a temperature gradient as high as 26°C (between the edge and core) at one point.
Additional trials would be required to determine if grain with higher moisture contents (or moisture contents closer to “safe to store” levels) or if grain stored in larger bins require different management strategies for summer storage.
More information from the bench scale trial will be available when those test bins are unloaded and the moisture content profile assessed. Stay tuned!
July 23 update
We are nearing the end of the planned monitoring period for this study. We will continue to monitor the in-grain temperature and relative humidity in bins 20 and 22 as long as the grain stays in the bins. Bin 21 is scheduled to be moved out next week.
For those watching the live feed display, you may have noticed some alarming temperature readings over the past week. However, we suspect that some of the sensors are failing. The temperature readings at the bottom of bin 21 fluctuated between -50°C and 80°C and five sensors are reporting relative humidities greater than 100% (which is not possible). It’s possible some of the sensors failed due to over-saturation or there is some sort of electrical glitch in the wiring. The remaining data appears to be reasonable and accurate. When bin 21 is unloaded next week, we will monitor the grain for crusting or heat damage and also have a look at the sensors that seem to be failing to determine the cause.
At the beginning of July, bin 21 was aerated during the evening hours in an attempt to SLOWLY warm the grain and minimize the temperature variations within the grain and between the grain and the ambient air.
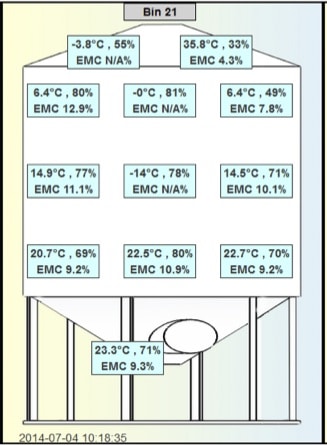
After 10 hours of fan operation (July 4 @ 10:18 am):
After 45 hours of fan operation (July 21 @ 11:02 am). The unreasonable values (due to possible sensor failures) are blocked from view:
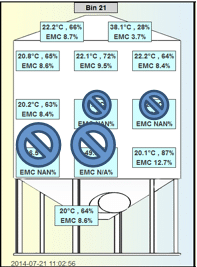
It took approximately 45 hours of fan operation (at 0.75 cfm/bu) to warm the grain and equalize the temperature in bin 21. The fan ran primarily in the evening hours (between 9 pm and 9 am) from July 3 to July 9. How does that compare to the fan time required to cool grain? The “rule of thumb” for cooling time is to divide 15 by the airflow rate (cfm/bu). The result is the number of fan hours required to cool grain. Using this guideline and 0.75 cfm/bu, it would take 20 hrs of fan operation to cool the grain. It took over double that to warm the grain.
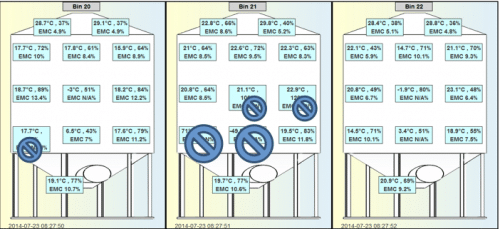
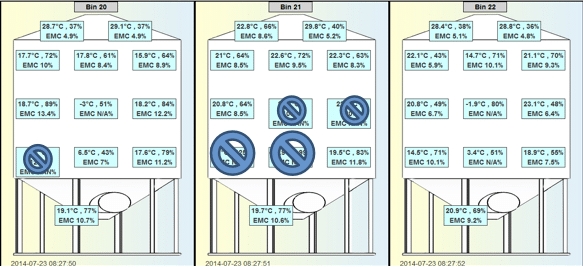
So did turning or warming the grain help improve storage conditions? A screencap of all three bins as of 8:27 am on July 23 is here (again, unreasonable values are blocked from view):
The incidence of moisture migration within the bins is best represented using absolute humidity values. Absolute humidity (AH) is the actual amount of water (g) held in a cubic meter of air. Both the temperature and relative humidity of the air are used to calculate the AH value.
The AH at each of the 9 in-grain locations in the bins at the start of the trial (June 6) are here:

The AH at each of the 9 in-grain locations in the bins as of July 23 are here:

Bin 20 (turned at the beginning of the trial): the core is still cool while the edges have warmed to nearly ambient temperatures. Moisture appears to have migrated to the walls and to the top of the bin.
Bin 21 (aerated at night to warm up grain): significant moisture was added to the bin, but as of July 23, the moisture and temperature distributions are uniform across the bin.
Bin 22 (left alone): the core is still cool while the edges have warmed to nearly ambient temperatures. Moisture appears to have migrated to the walls and top of the bin.
Are these observations consistent with conventional knowledge of convection currents and moisture migration in bins? The following figure (courtesy of AAFC) shows the theoretical convection currents and potential locations of high moisture grain for winter storage (A) and summer storage (B).
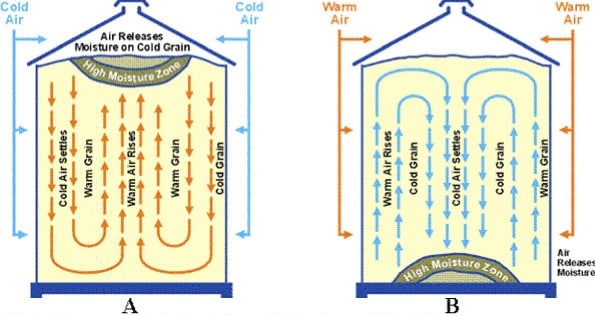
Based on this graphic, we would expect moisture to migrate to the bottom of the bin during summer storage. However, we are seeing moisture migration to the top of the bin (using the absolute humidity data). The issues with the sensors at the bottom of bin 21 may indicate a possible high moisture zone there, but we did not see the same effect in bin 20 (the baseline bin). The moisture content and condition of the grain in bin 21 will be inspected when it is unloaded next week and those observations will be included in the next blog update.
The average absolute humidity (AH, g/m3) in each bin at various times during the trial are shown in the following table:
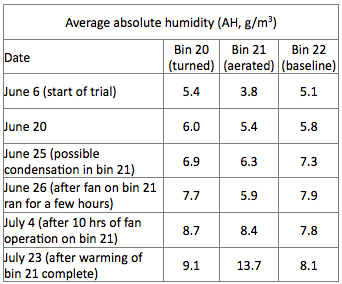
Therefore, the increase in the average AH in bin 20, 21 and 22 was 3.7, 9.9 and 3.0 g/m3 respectively. According to this data, the baseline bin has seen the least amount of moisture addition. The change in actual moisture content of the grain will be determined when the grain is unloaded.
In the last update, the effect of airflow rate on warming rate of canola was summarized using the data collected from our small test bins (6 bins with a capacity of 15 bushels each). Because of the small diameter (18 inches) of the test bins, there was significant warming due to ambient heating around the bin. The average time to warm the grain and reach equilibrium for each airflow rate in the test bins is shown in the table below.
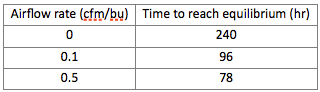
Note that, in the large bins, it took 45 hours of fan operation at 0.75 cfm/bu to warm the grain. Also note that in the large bin with no airflow and no grain disturbance (bin 22), we still have not reached uniform temperature distribution due to ambient warming (and we have been monitoring for 1128 hours and counting). So it appears that the small test bins generate representative and scalable results when there is airflow, but are not representative for zero airflow situations.
How did airflow rate affect the moisture addition to the small test bins? The average absolute humidity (AH, g/m3) for each airflow is shown below for the beginning and end of the test bin trial.
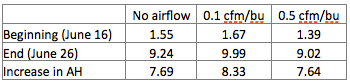
Therefore, higher airflow rates reduce the time required to reach temperature equilibrium, but higher airflow rates do not appear to add more moisture than lower airflow rates. Note that, for this test bin trial, the fans were operating 24 hours a day. The actual moisture content of the grain in these test bins will be measured when they are unloaded. Stay tuned!
July 4 update
Due to the moisture migration and potential for wet spots in bin 21, bin 21 is now being aerated instead of bin 22. Note that the fan on bin 22 had not been turned on yet, so bin 22 is now considered the untreated or baseline bin for this study. The grain in bin 20 was turned at the beginning of the study (June 3) and, since then, has been left alone. Note that the sunny side headspace sensor on bin 21 was pushed into the grain between the top middle and top sunny side edge sensors to continue to monitor the grain surrounding the hot spot that was removed on June 17.
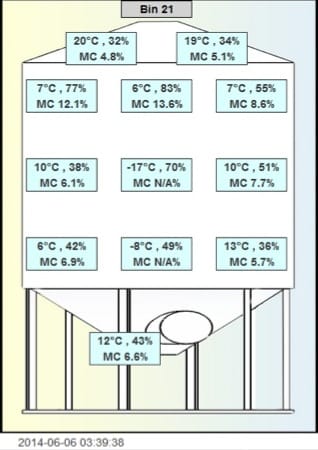
Why did we decide to aeration bin 21 instead? In addition to the hot spot that was detected near the top of bin 21, we noticed a potential wet spot on the sunny side of the bin. Here is a screencap of the temperature and relative humidity data inside the bins on June 25:
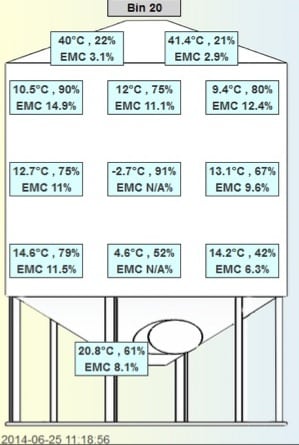
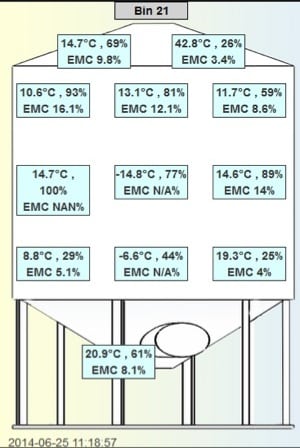
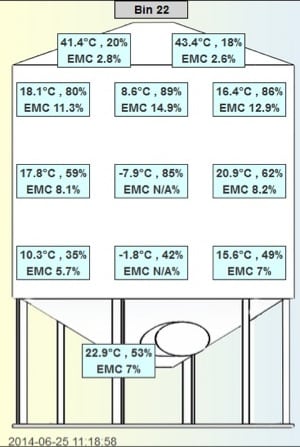
The relative humidity of the middle sunny side sensor in bin 21 slowly increased and finally hit 100% on June 25. A relative humidity of 100% indicates that the air surrounding the grain at that point reached saturation. Therefore, it is possible that moisture was condensing on the grain in that part of the bin. The equilibrium moisture content (EMC) equation is not valid for 100% relative humidity, so the EMC reading is not applicable.
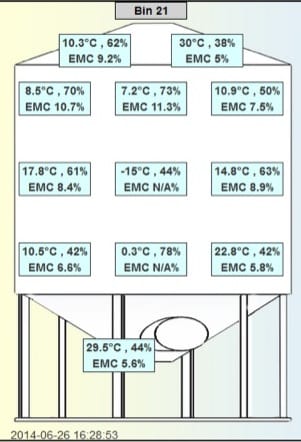
Because of this potential wet spot, we decided to run the fan on bin 21 at a target airflow rate of 1 cfm/bu or 4000 cfm. The fan was on for approximately two hours on June 26, then turned off due to the extended wet weather that hit Saskatchewan and Manitoba at the end of June. After approximately two hours of fan operation, the relative humidity at the edge of bin 21 had dropped to 61%:
Also take note of how the temperature of the grain was affected due to fan operation. The temperature of the grain at the middle/bottom of bin 21 increased from -6.6°C to 0.3°C and the temperature of the grain at the edge/bottom of bin 21 also increased by a few degrees. The temperature of the grain at the top actually cooled by a few degrees, likely due to the airflow pushing cool air from the bottom of the bin through the grain to the top. They key point, though, is that airflow helped to distribute the water vapour in the air within the grain which will minimize the formation of wet spots.
Now that the rain has stopped (for now!), the fan on bin 21 will be operated during the evening hours to continue the slow warming of the grain in bin 21 and to help keep the water vapour evenly distributed. The fan was operated from 9 pm on July 3 to 7 am on July 4. A screencap of the bin conditions on July 4 at 10 am (3 hours after the fan was turned off) is here:
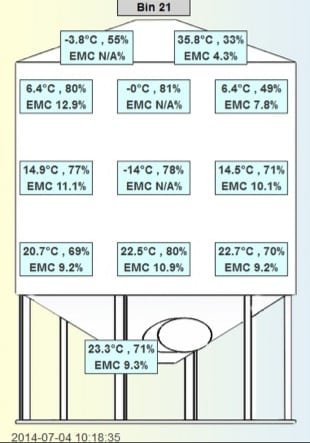
At this point, the warming front has still not reached the middle of the bin after approximately 10 hrs of fan operation, but the grain at the bottom of the bin has warmed and is now uniform across the diameter of the bin. A uniform temperature will help minimize moisture migration, but grain with a temperature above 15°C has a shorter “safe storage time”. The potential for spoilage in canola based on grain temperature and moisture content is shown below (courtesy of the Canadian Grain Commission, 2013).
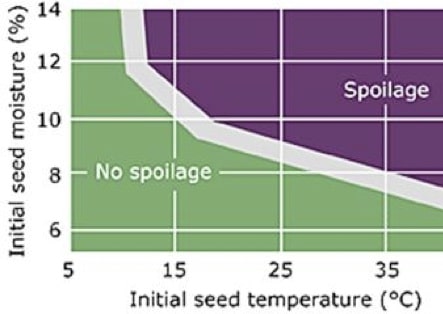
So summer storage of grain is a balancing act between prevention or minimization of moisture migration (by maintaining a uniform temperature distribution) and maintaining cooler (less than 20°C) temperatures. We will continue to run the fan on bin 21 during the evening hours throughout July and monitor the temperature and relative humidity values.
Note that we are now seeing high relative humidity’s in bin 20 (the turned bin) as well. We will continue to keep an eye on bin 20 and, if the conditions deteriorate, we will turn on the fan on that bin as well.
Based on a quick glance of the bin conditions, it appears that bin 22 (the untreated bin) has the best storage conditions and least amount of moisture migration. HOWEVER, it must be noted that bin 22 is a smaller bin and is only two thirds full. Bin 22 is holding 2800 bushels while bins 20 and 21 are holding 4000 bushels of canola. Ideally, we should be monitoring three identical bins, but it was difficult to find three bins of canola in close proximity that would be stored throughout the summer. So we must be careful to correctly interpret the data we are collecting.
A summary of the initial grain parameters in each bin is shown in the following table:
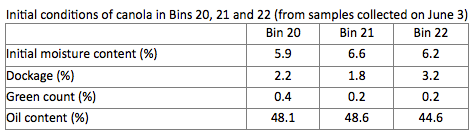
For bin 20, composite samples were collected during the unloading and reloading of the turned grain. The results in the table for bin 20 are an average of two samples. The results in the table for bins 21 and 22 are from a single composite sample collected from the top 4 ft of the grain using a sampling probe. Moisture content was analyzed using a Labtronics moisture meter. Samples were analyzed for dockage, green count and oil content by Richardson Pioneer at Dixon, SK.
We have continued to collect samples from the top 4 ft of grain in bin 21 to monitor the moisture content and potential moisture migration. The following table summarizes those results.
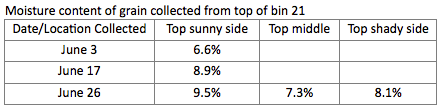
The increasing moisture content of the grain from the top of bin 21 indicates moisture migration to the top of that bin. The temperature and relative humidity (and EMC) values in bin 21 also indicate moisture migration to the top of that bin. A sample from the top of bin 22 (the untreated bin) was also collected on June 17. The moisture content of that sample was 6.5%, indicating no change from the start of monitoring on June 3 (which agrees with the temperature and relative humidity readings in that bin).
Finally: a quick update on the bench scale testing that was started on June 16 using PAMI’s six small test bins. Each bin was wrapped with an insulated tarp to slow the ambient warming effect.

All bins were loaded with canola (moisture content = 8.3%) that was frozen to -25°C. During loading, the canola warmed up due to contact with ambient air and due to friction as it passed through the augers. The average grain temperature once it was in the bins was -9°C.
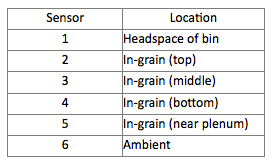
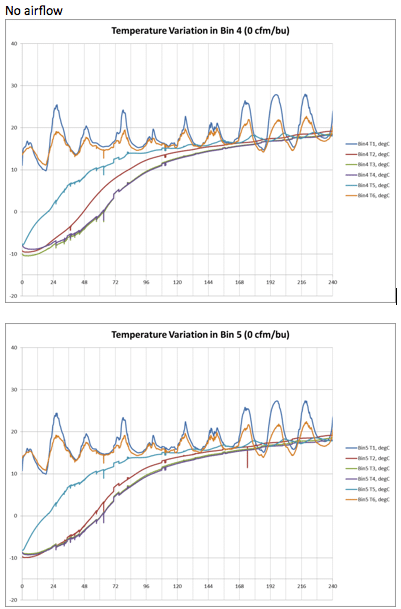
Two bins were aerated at 0.1 cfm/bu, two bins were aerated at 0.5 cfm/bu and two bins had no airflow. The fans were started at noon on June 16 and the temperature and relative humidity data was logged in each bin at six locations:
The observed trends were not surprising: the higher the airflow rate, the faster the grain warmed or equilibrated with the ambient temperature. Refer to the following graphs where the horizontal axis represents time (hours, time zero is noon on June 16) and the vertical axis represents temperature (°C):
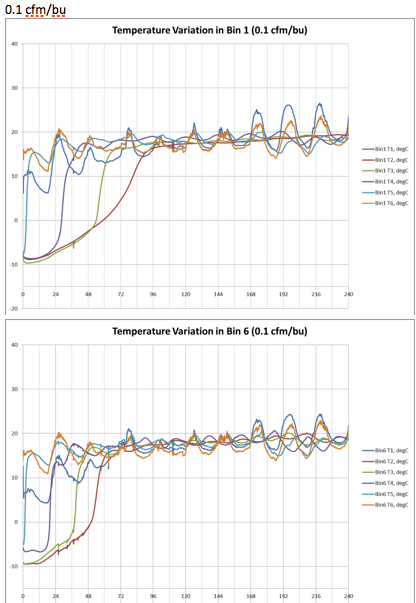
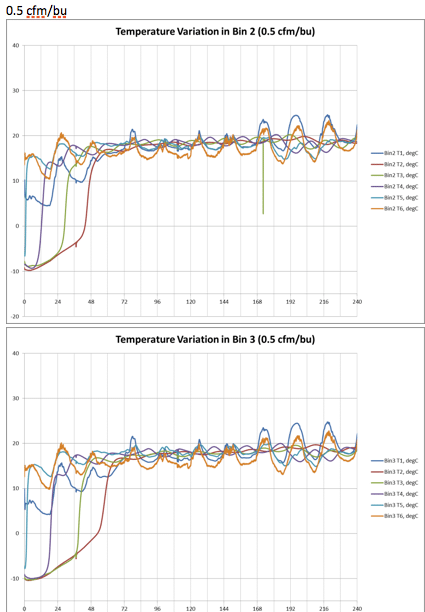
We will continue to monitor the temperature and relative humidities to observe how airflow rate affects the temperature and absolute humidity distribution in the test bins now that they have warmed up to ambient temperatures. The next update will also include information on how the airflow rate affected the absolute humidity (actual moisture) in the air in these test bins. Stay tuned!
June 20 update
Have you been watching the temperature and RH changes in the three canola bins? We are definitely seeing some changes! Remember that bin 20 was “turned” at the start of the trial, bin 21 is left alone as a baseline and bin 22 will be aerated. ***The fan on the aerated bin has NOT been started yet. See below for details.***
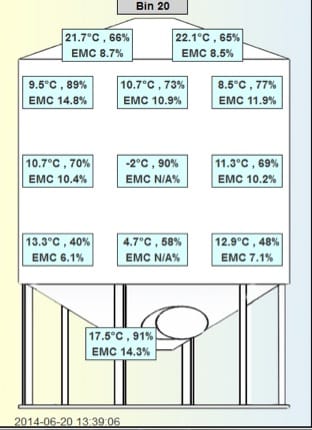
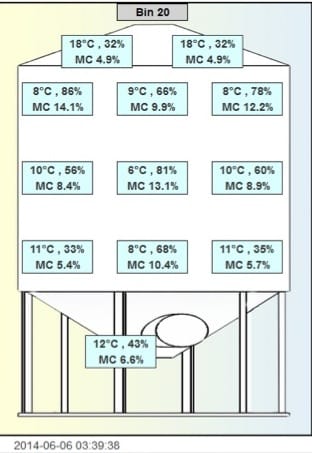
Remember that bin 20 was turned before the sensors were installed on June 3. The temperature distribution in bin 20 on June 6 looks quite uniform, but by June 20, we see that the center of the bin is cooling. Why? Because when a portion of the grain is pulled out, it funnels through the center of the bin (also known as a “rat hole”). So the grain in the center of the bin used to be on the top (which was warmer than the core due to ambient warming). The grain between the core and the edge of the bin remains relatively unmoved.
When we installed the sensors, we were monitoring the grain in the center of the bin and at the edges of the bin. The grain at the edges was warm due to ambient warming and the grain in the center was warm because it used to be the grain on top. But the grain between the edge and the center was still cold (-20°C or colder). The grain in the center is slowly equilibrating to the temperature of the colder grain next to it (and vice versa). Therefore, we see that the grain in the center of bin 20 is cooling.
The grain at the edge of bin 20 is theoretically also equilibrating to the temperature of the colder grain next to it, but it is also equilibrating to the ambient temperature on the other side of it. So the temperature at the edge of the bin has remained relatively stable.
The grain in the centre of bin 20 has stabilized at approximately -2°C. This is much warmer than the temperatures in the center of bin 21, which has the same amount of grain and started at the same temperature. Therefore, turning the grain in bin 20 did help to minimize the temperature variations in the bin. The canola in bins 21 and 22 is also slowly warming with the temperature at the edge of the bin increasing slightly more than the temperature in the core of the bin. So far, there is not a large or consistent difference in the temperature between the “sunny side” (left side of graphic) and “shaded side” (right side of graphic) of the bins.
HOWEVER, we are seeing interesting changes in the relative humidity (RH) readings. Remember that relative humidity is a measure of how much water the air is holding based on how much water it can hold. When the air is “full” or “saturated”, it will have an RH of 100% and water will condense on a nearby surface.
Warm air can hold more water than cold air. One cubic meter (m3) of air at 10°C can hold approximately 10 g of water before it is saturated. So if one m3 of air at 10°C is holding 5 g of water, it is “half full” and has a relative humidity of 50%. If that one m3 of air warms up to 20°C, it would be able to hold approximately 20 g of water. If it is still holding 5 g of water, its relative humidity would then be 25%. Generally, when the temperature increases, you would expect to see the RH decrease (and vice versa). That assumes there is no moisture gain or loss in the measured air.
Since the RH fluctuates based on temperature as well as actual water content, an easier way to compare the amount of moisture in the air surrounding the grain is to compare the absolute humidity values. Absolute humidity is the actual water content of the air and is based on both the temperature and relative humidity of the air.
The graphic below shows the absolute humidity (gram of water per m3 of air) of the in-grain air at each of the sensors on June 6 and June 20. The average absolute humidity increased by 0.6 g/m3, 1.6 g/m3 and 0.7 g/m3 for bins 20, 21 and 22, respectively. Note that the absolute humidity of the grain in the sunny side middle of bin 21 increased from 4 to 11 g/m3. That increase is possibly an indication of moisture migration to that spot.
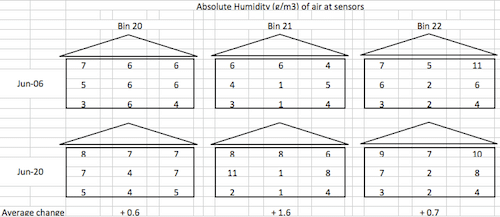
Absolute humidity (g/m3) of air in-grain at 9 sensor locations in each bin. Top row is for readings taken on June 6, bottom row is for readings taken on June 20.
Also note that the sensors are only monitoring the air in the grain immediately surrounding the sensor. Each sensor is monitoring approximately 1 ft3 of the grain around it. That means, for a 4000 bushel bin, we are monitoring approximately 0.2% of the bin.
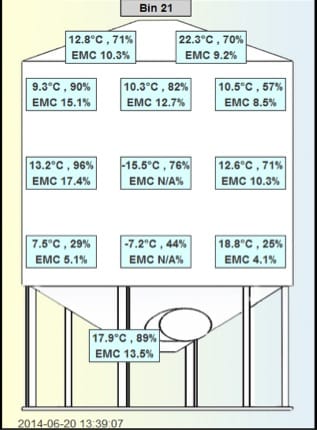
On June 17, a “hot spot” was detected at the top of bin 21 (the untreated bin). This spot was likely the result of moisture from snow that had entered the bin during the winter. Approximately 30 bushels of grain was removed (by vacuum) and the headspace sensor was placed in the grain to continue to monitor this area. Therefore, the sunny side headspace sensor for bin 21 is actually reading the grain temperature and RH just below the surface between the core and edge of the bin.
Because of the presence of this “hot spot” and the possible moisture migration occurring in bin 21, this bin may be aerated instead of bin 22 to minimize the chance of spoilage in bin 21. The fan will be turned on during the week of June 23.
Finally, the small bin testing started on June 16. Six test bins, each with a 15 bushel capacity, were loaded with frozen canola. Two bins have no airflow, two bins have an airflow of 0.1 cfm/bu and two bins have an airflow of 0.5 cfm/bu. The in-grain temperature and relative humidity is being logged. I will provide a summary of the warming trends for each airflow rate in the next update!
June 6 update
(The update continues below the photo series.)
12 sensors for each bin
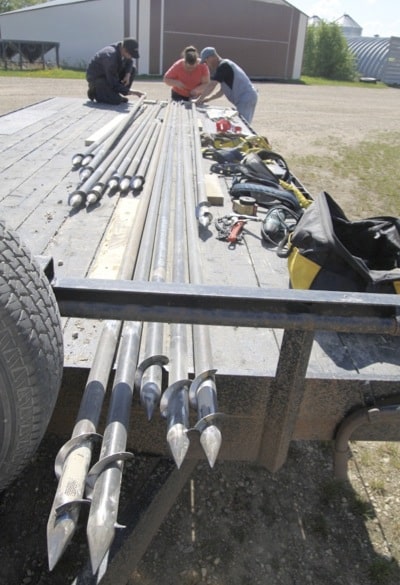
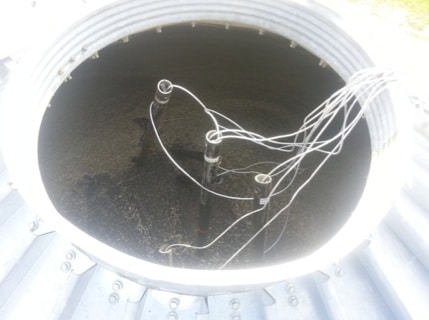
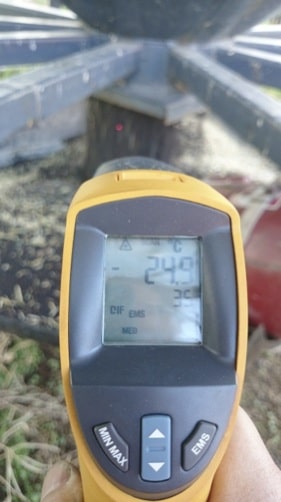
As turned grain was removed, its temperature was taken. Yes, that says -25°C.The height of each of the three bins was measured to determine the required lengths and angles of the probes to ensure proper positioning of the sensors. Between May 30 and June 3, each bin was instrumented with sensors at 12 locations. At each point, temperature and relative humidity are measured. Nine of the locations are in the grain, two locations are in the bin headspace and one location is near the fan to record ambient conditions.
Of the nine in-grain sensor locations, three are positioned down the center of the bin (bottom, middle, top). Three are positioned down the edge of the bin (within 1 ft of the wall) on the predominantly sunny side of the bin and three are positioned down the edge of the bin (within 1 ft of the wall) on the predominantly shaded side of the bin. The purpose of the sensors down the walls is to try to measure moisture migration within the bin.
The two headspace sensor locations are measuring the bin headspace near the edges of the bin, one located on the predominantly sunny side and one located on the predominantly shaded side. The bin lids have been closed to represent typical storage conditions.
Each bin will have a different management strategy. One bin will be left alone throughout the trial as a baseline. One bin was “turned” before the sensors were installed and the third bin will have an aeration fan running (target airflow rate is 1 cfm/bu) during the evening hours to slowly bring the temperature of the grain closer to ambient. [Note: the aeration fan will be started the week of June 9].
For the “turned” bin, 700 bushels of canola were pulled out of the bin and augered back in. Grain was pulled from the bin until all of the grain on the top surface was removed. This ensured the entire top layer of grain and any moisture that had migrated to the top was disturbed. The temperature of the canola that was removed from the bin was between 0° and -28°C, and the temperature of the same canola returned to the bin was approximately 0°C to 5°C (after handling).
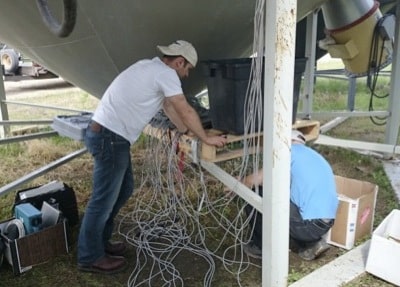
Information from all 36 sensors is available on the real-time display posted at http://grain.pamifiles.ca/display.php
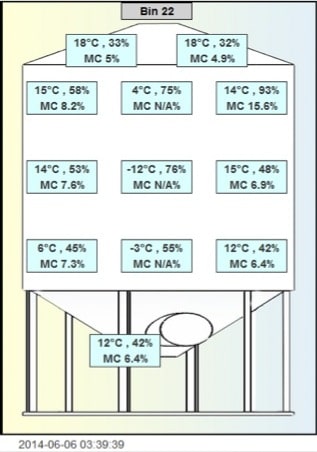
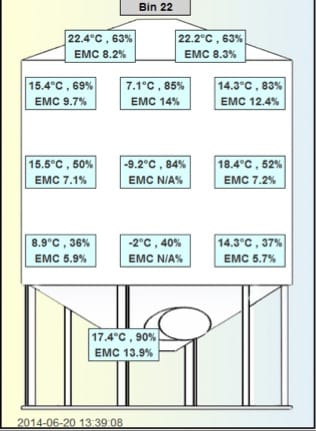
The graphic shows the real-time temperature (°C) and relative humidity (%) as measured by each of the sensors. The measured temperature and relative humidity were used to estimate the Equilibrium Moisture Content (EMC) of the air for canola using the Modified Henderson Equation (based on the ASABE Standard). The EMC of the air is NOT necessarily equal to the actual grain moisture content. The EMC of the air represents the moisture content that the grain would eventually reach if the air conditions (temperature and RH) remained constant for a certain period of time. The EMC equation is not valid for cooler temperature (less than 5°C). Therefore, if the in-grain temperature is below 5°C, the EMC readout is N/A.
Information on the starting grain moisture content, green seed content and oil content will be available soon. The on-going monitoring of these bins will also include some sampling to verify the data collected by the sensors. For example, the top right area of bin #22 appears to be a wet spot (with an EMC of 15.6%). A grain sample from this location will be collected within the next week to determine the actual moisture content of the grain.
Keep checking back to www.canolawatch.org throughout the summer for updates on the temperature trends and effectiveness of each bin treatment. PAMI is also conducting smaller bench-scale bin trials using different starting grain temperatures and different airflow rates to help assess warming rates and conditions that result in condensation in the grain. Stay tuned for details and results.