Seeding date decisions are often driven more by historical frost risk than present conditions. That is why many growers will not seed canola before May 1, even if their area had what seemed like favourable seeding conditions in April.
Historical frost risk can be interpreted differently based on the crop’s frost tolerance and the grower’s appetite for risk.
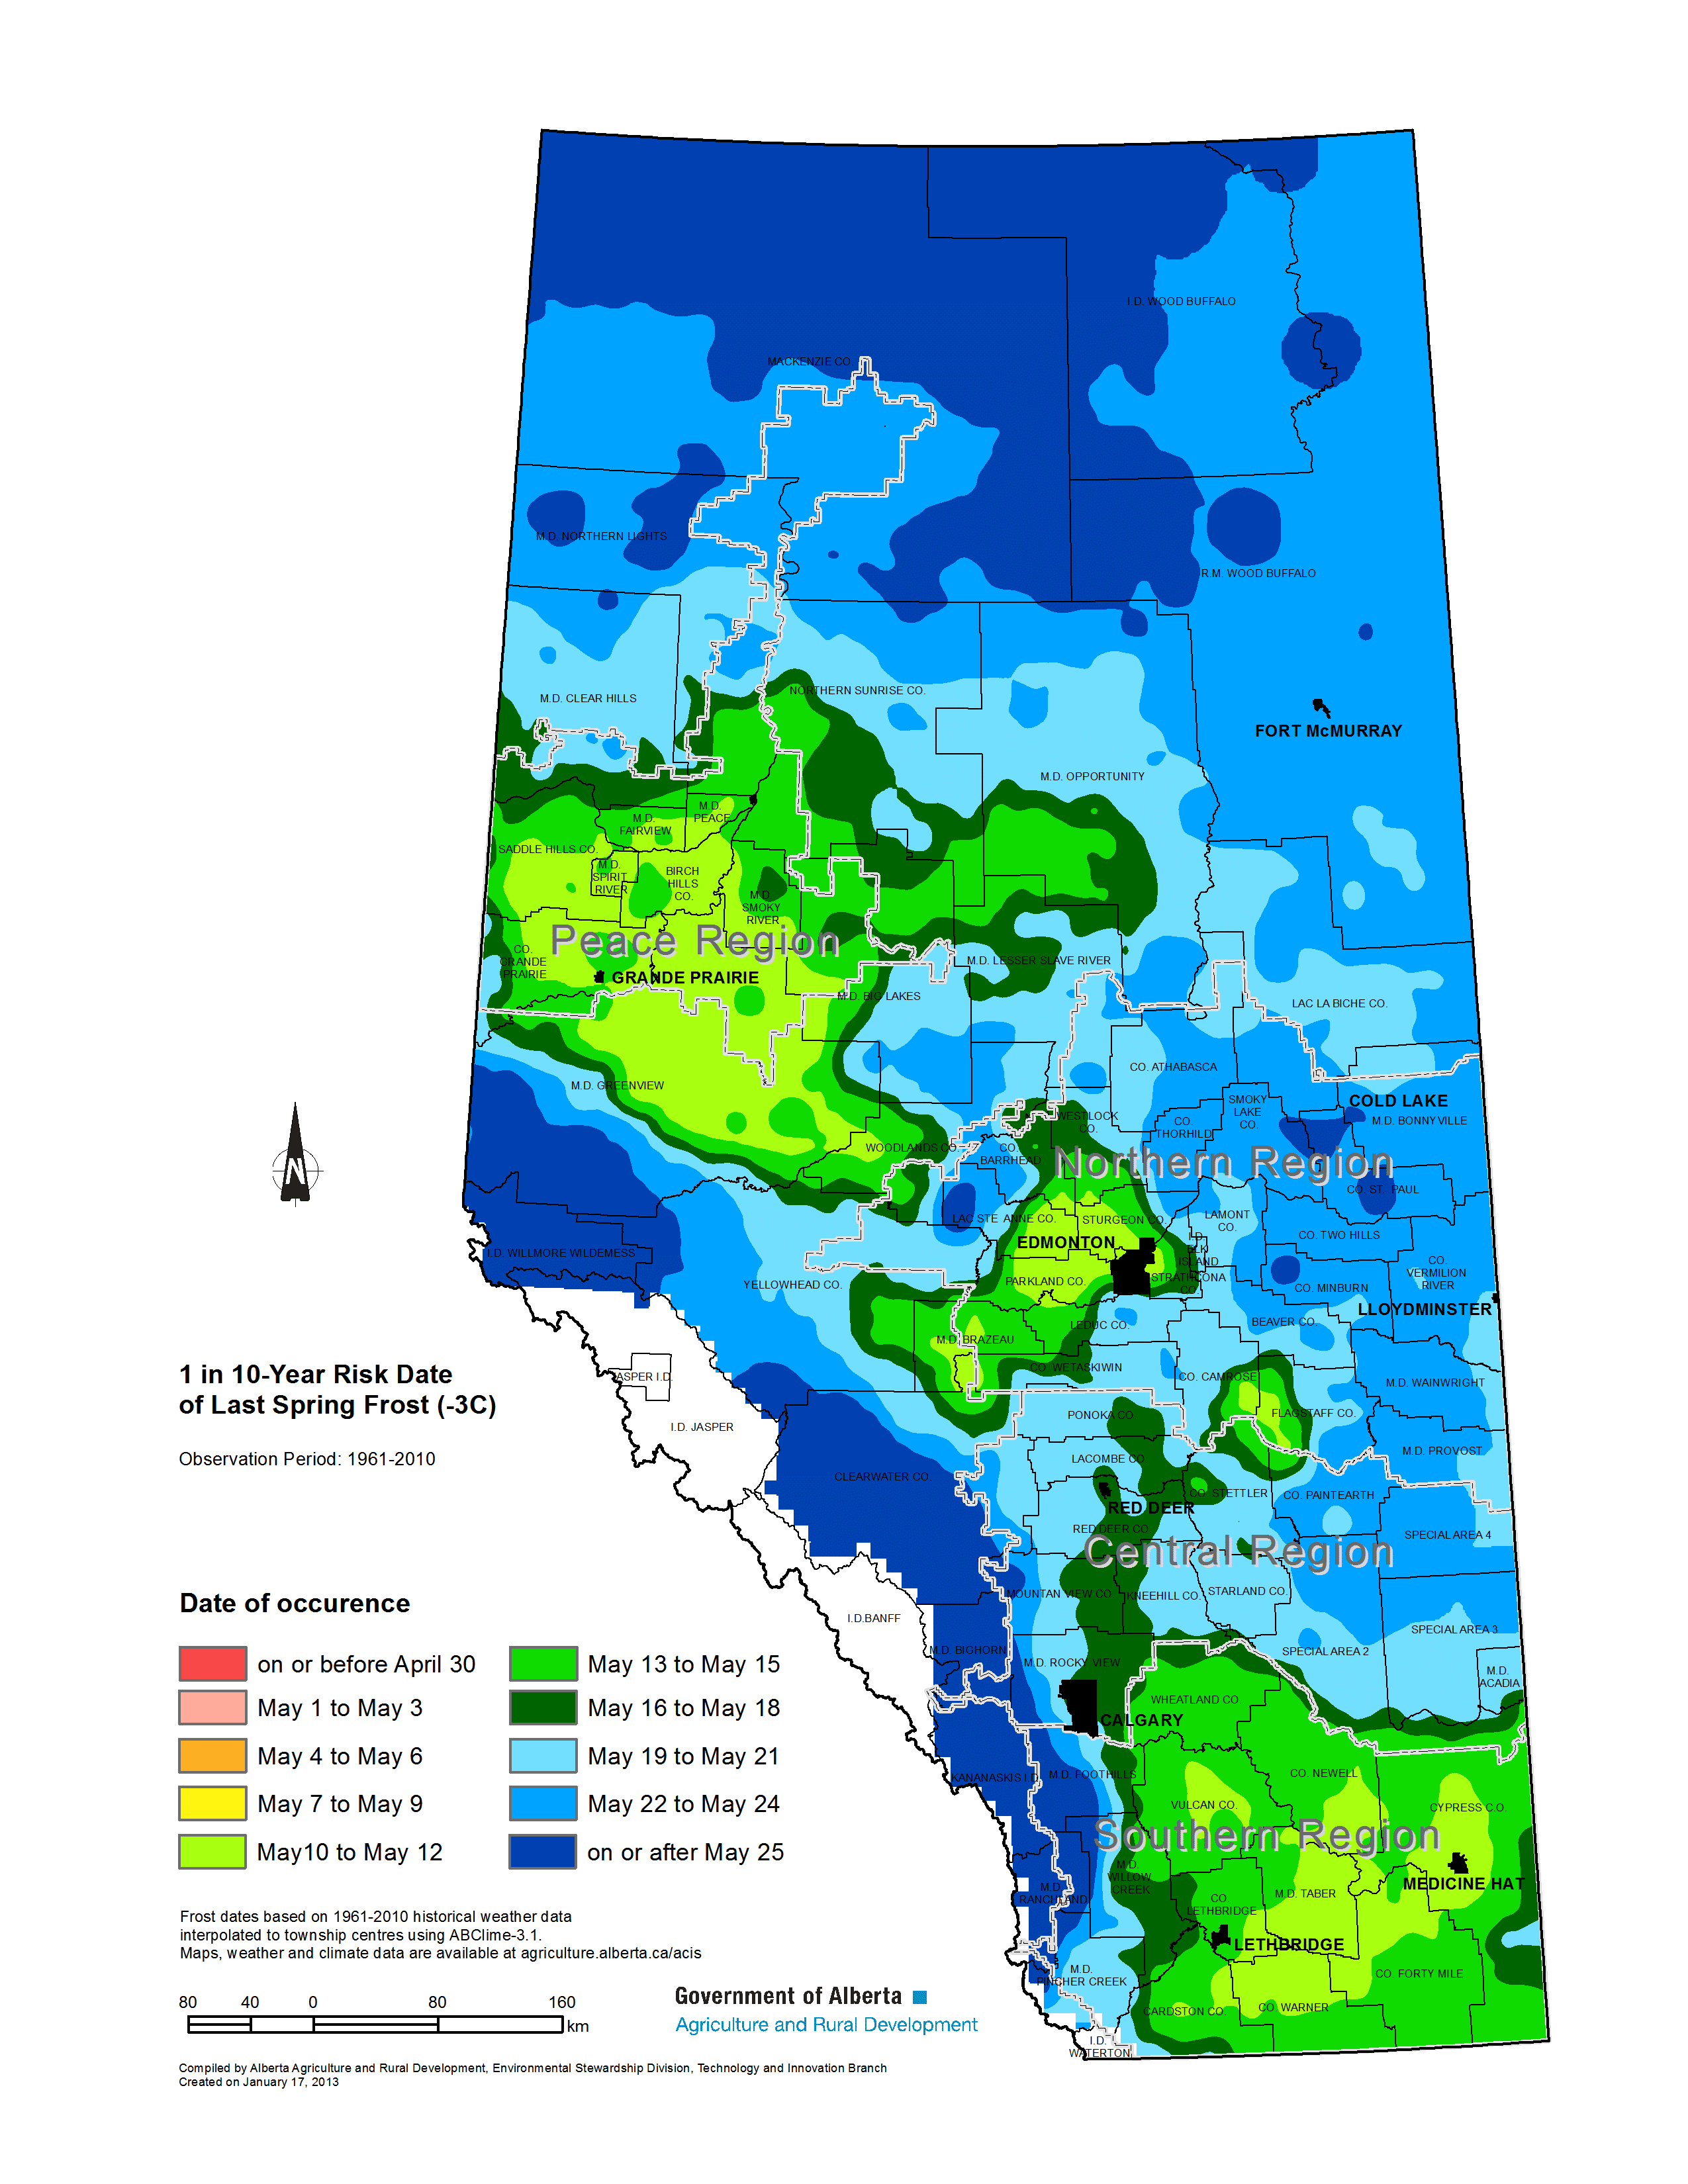
Frost tolerance: For canola, a killing spring frost may be closer to -2°C or -3°C, so that is a good temperature to use for decision making. Factors such as weather leading up to the frost (warm weather increases frost damage), humidity and landscape can influence frost damage, as described in this podcast.
Risk tolerance: Are you OK with a 50% probability of a killing frost? Or does 25% or 10% suit you better?
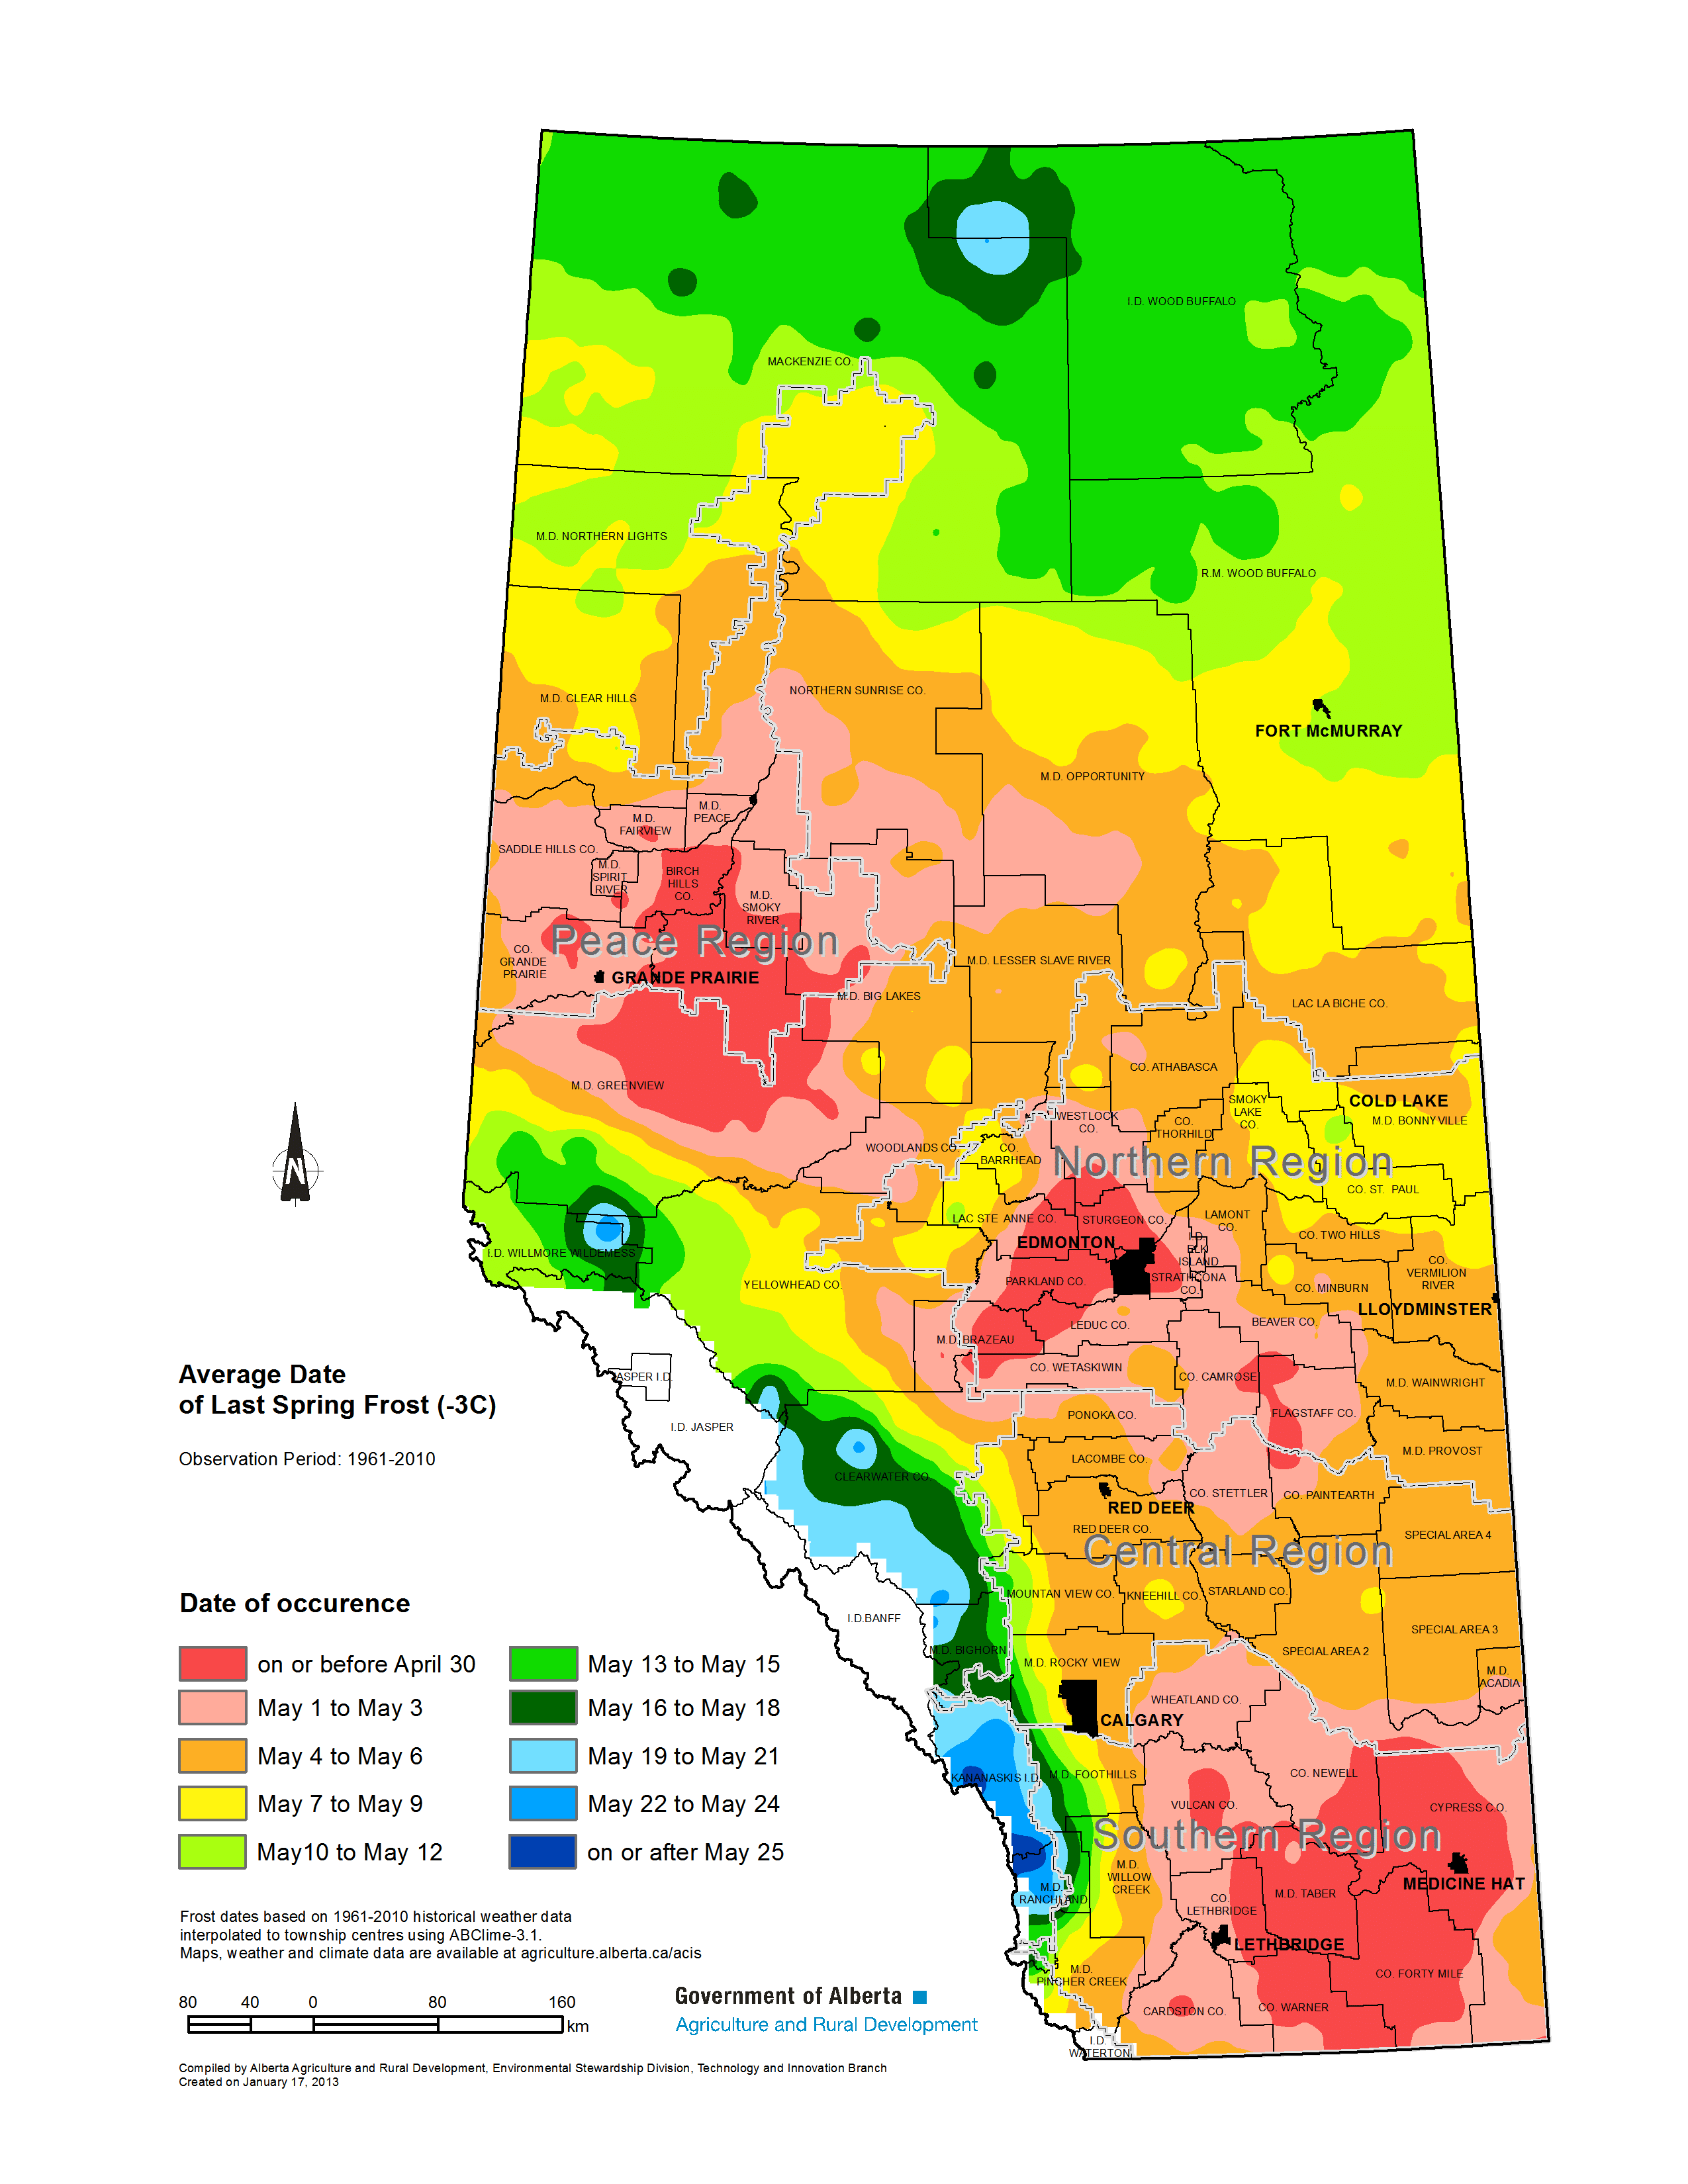
The “average date” of the last -3°C frost means half the time the last -3°C frost was AFTER that date. (50% probability)
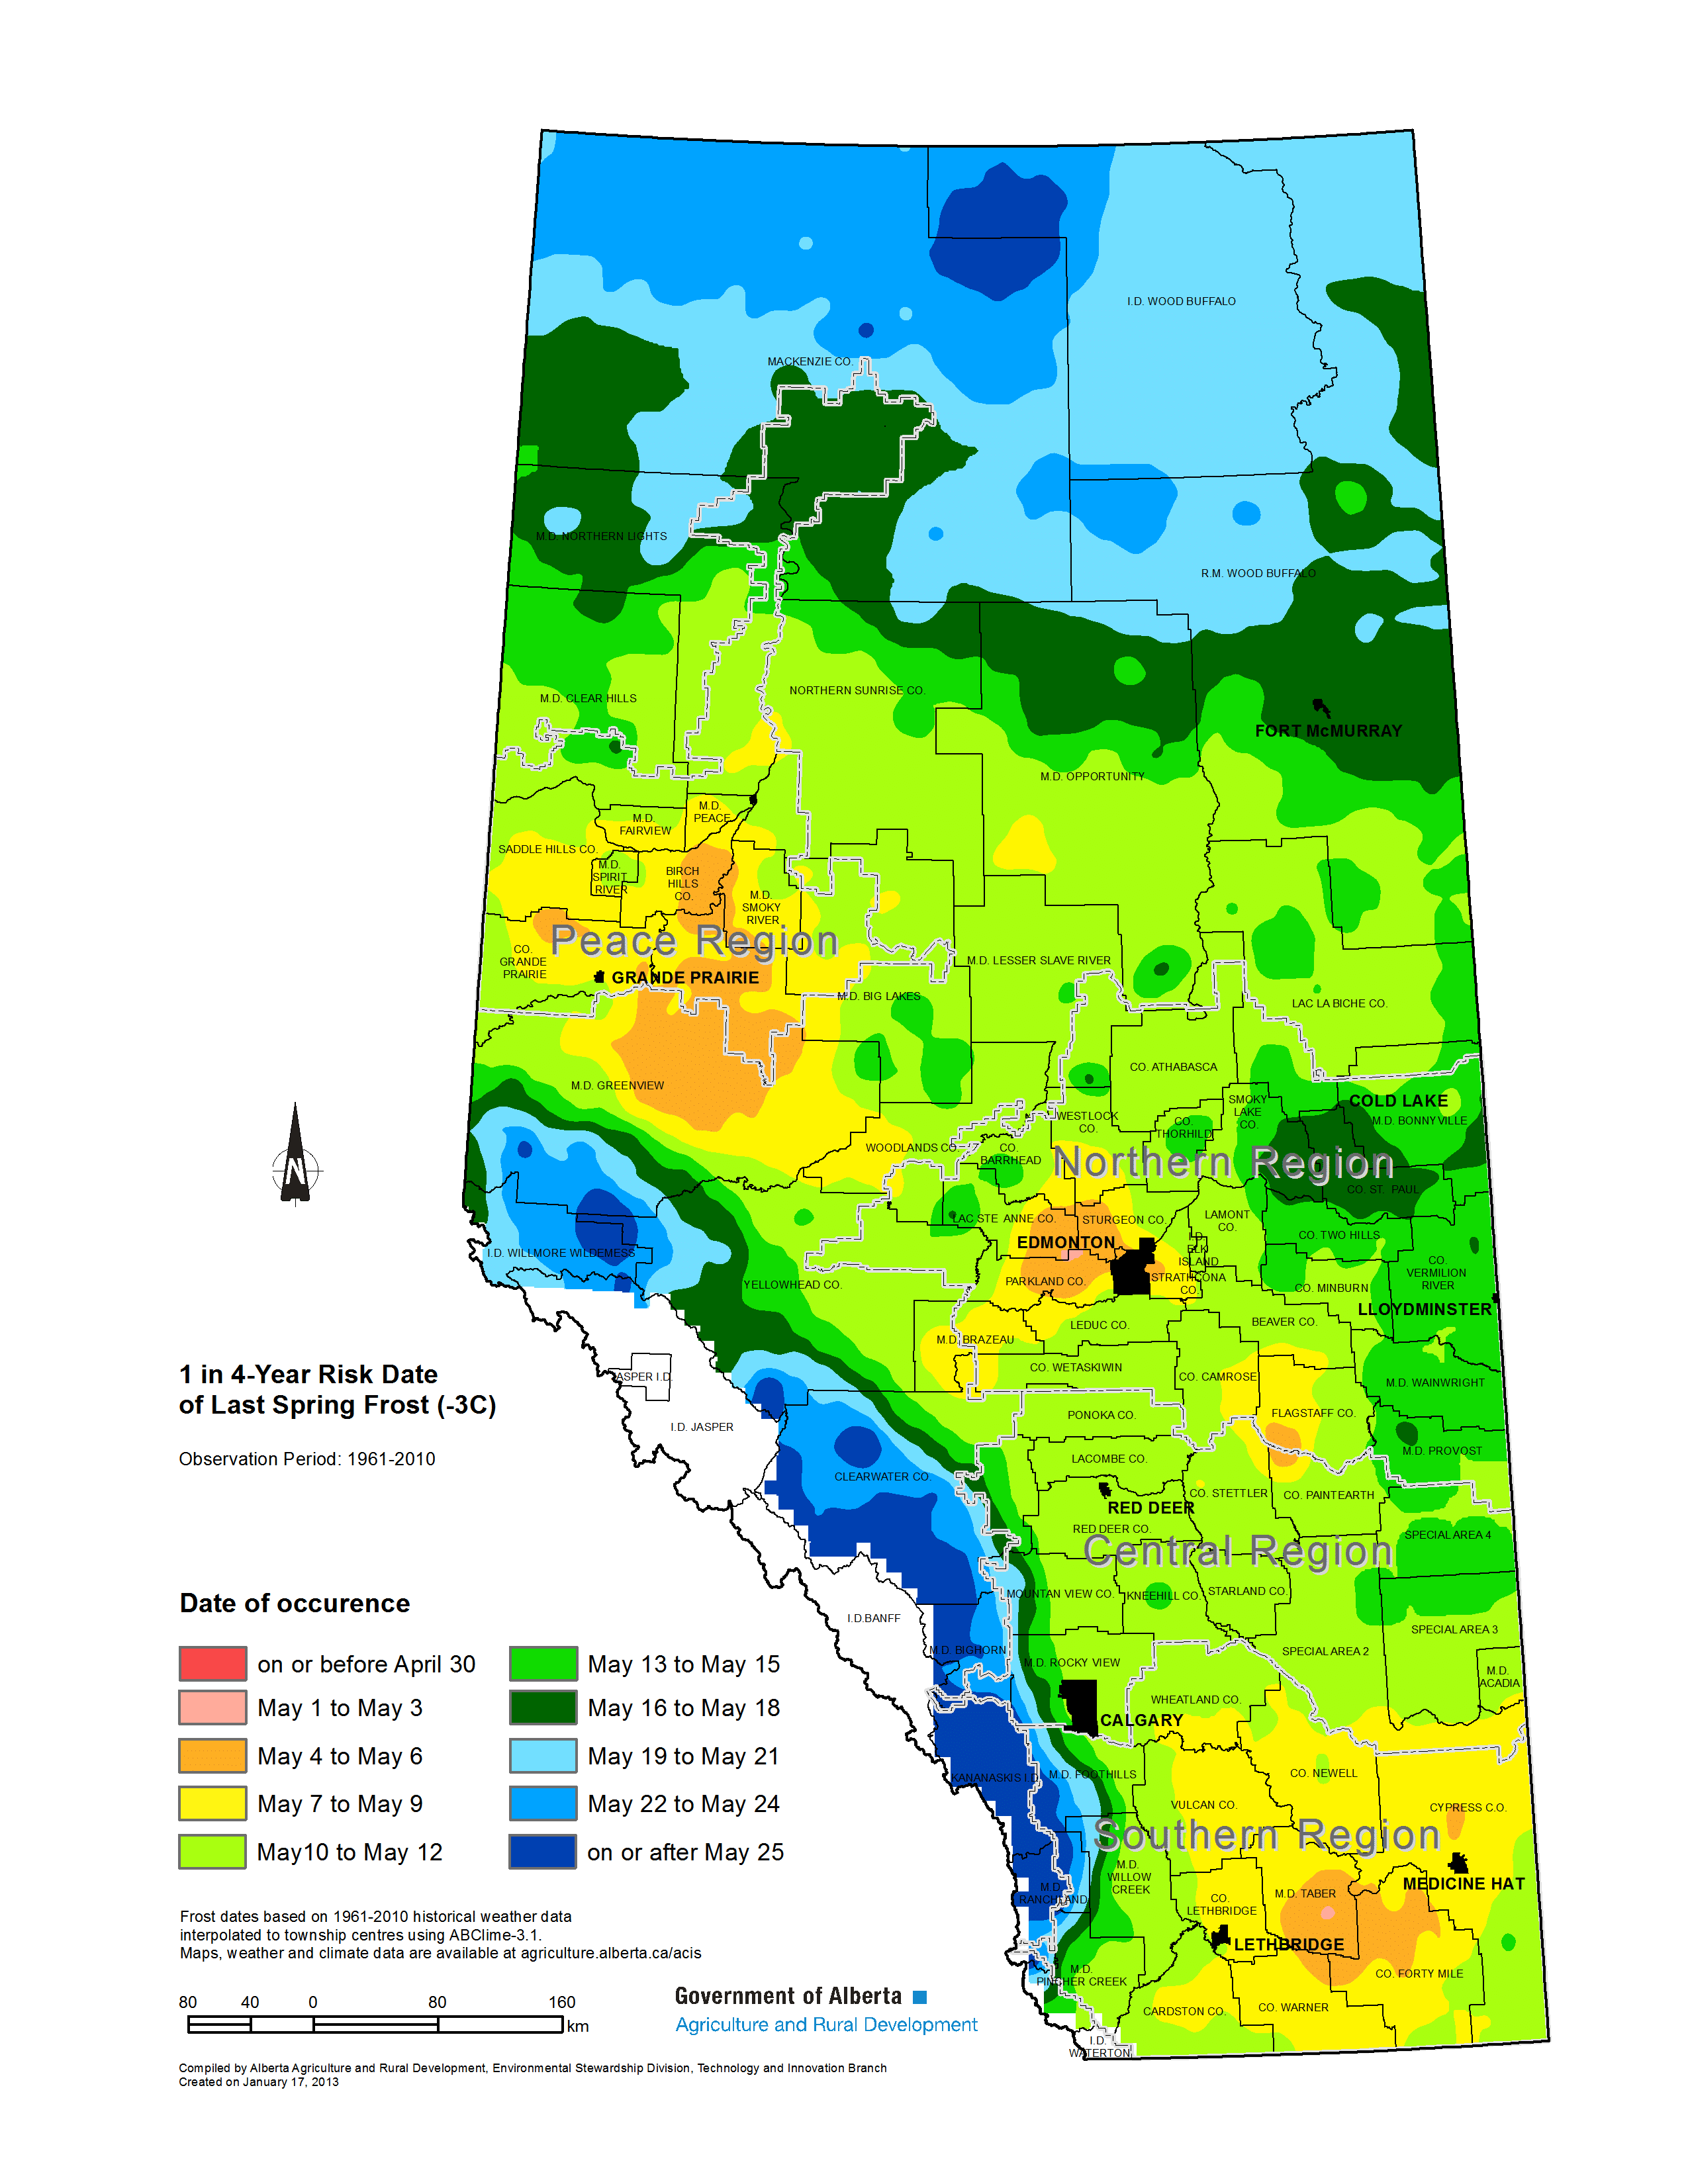
Growers who want a lower frost risk may base their seeding decisions on the date when the killing frost risk drops to 25% probability or 10% probability.
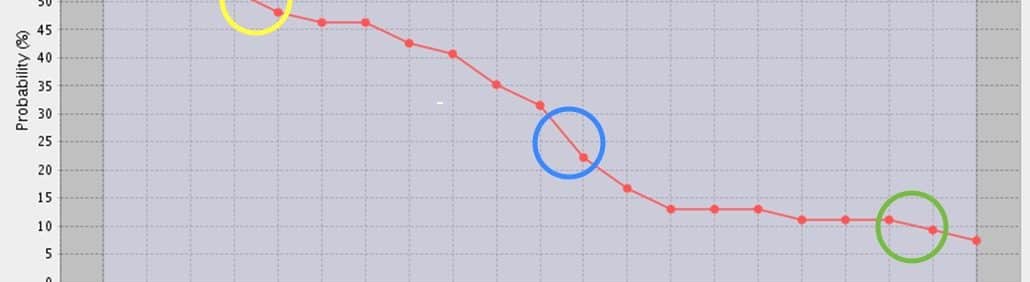
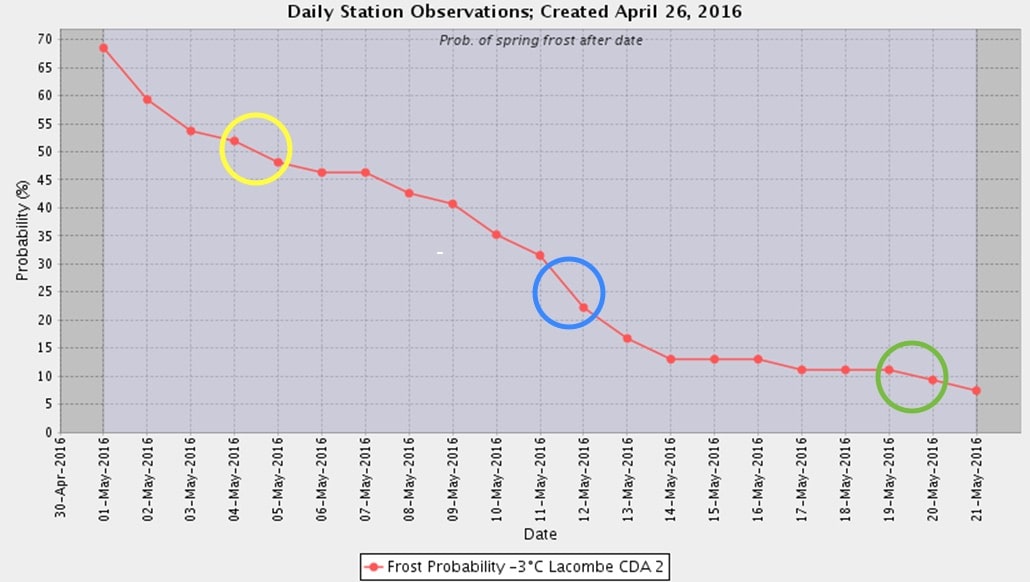
Example: Frost data for Lacombe, Alberta show:
50% probability of -3°C frost is around May 4.
25% probability is May 11
10% probability is May 20
With these frost dates, growers then subtract the expected days from seeding to emergence to find a start date for seeding. In early May, canola takes 10 days or so from seeding to emergence. Growers around Lacombe who want to limit their frost risk to a 25% probability would take May 11 and subtract 10 days for emergence. That gives them a date of May 1 to start seeding.
For more Alberta data, use the Current and Historical Alberta Weather Station Data Viewer.
How to use the viewer: On the map, find Lacombe and click on its green dot. On the panel to the left of the map, click on the “Normals” tab. Click the box with the frost level probability you are interested in. We have been using -3°C for this article. At the bottom of that panel, choose start and end dates for the graph. May 1 to May 21 works well for frost probabilities. Then click “graph”. You get this…
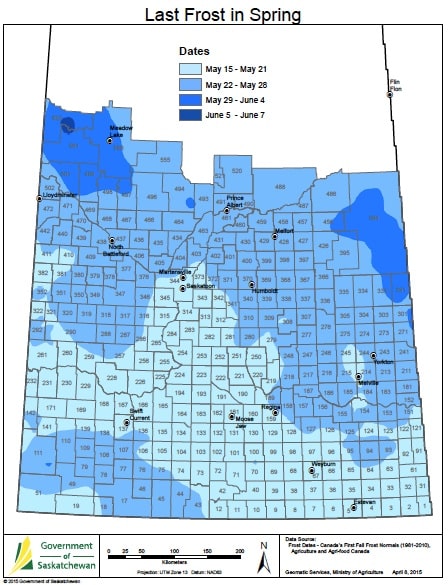
Saskatchewan has the following map showing the average last day of a 0°C frost:
Manitoba has prepared maps showing 10%, 25% and 50% probabilities for a 0°C frost. Below is the 25% probability map. Find the others here.

Environment Canada does have some frost information for various locations at this site. Search your location, click the “Normals” tab at the top, then scroll down to find “Frost free”. That table gives the last 0°C frost date for various probability scenarios.