PODCAST: Spring frost risk and seeding date

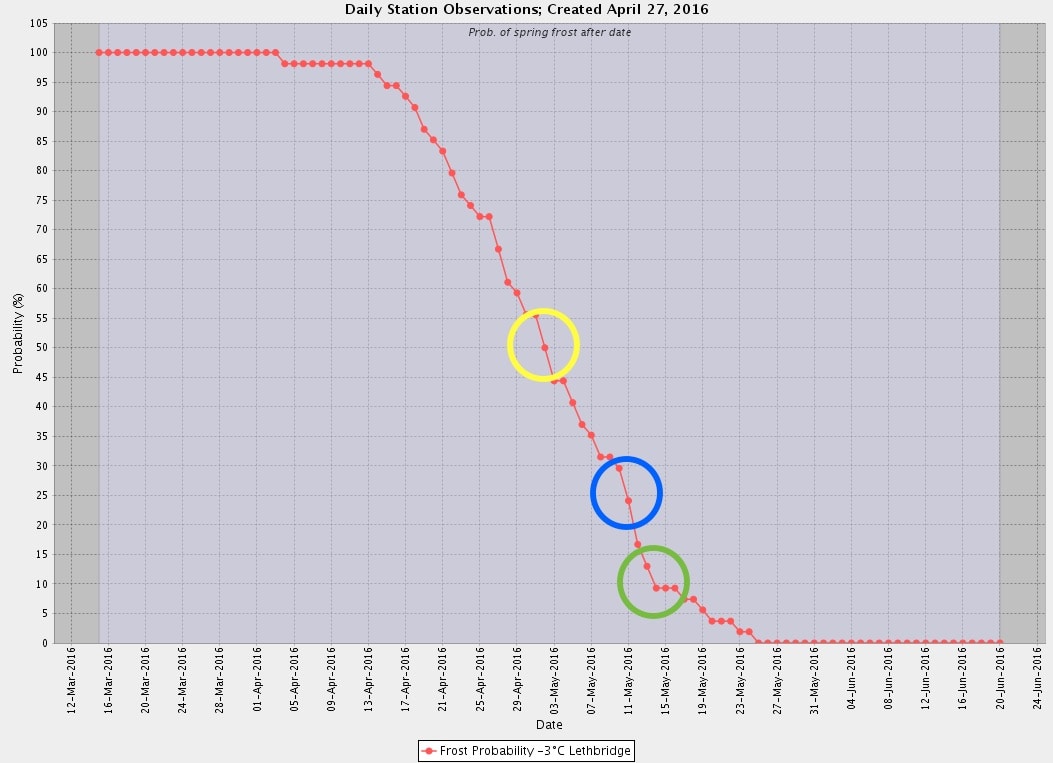
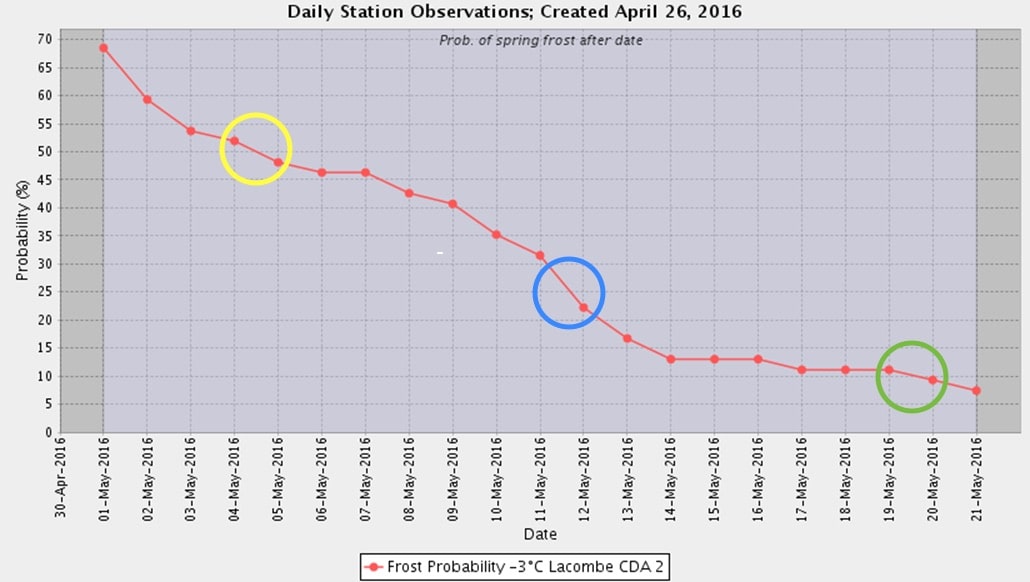
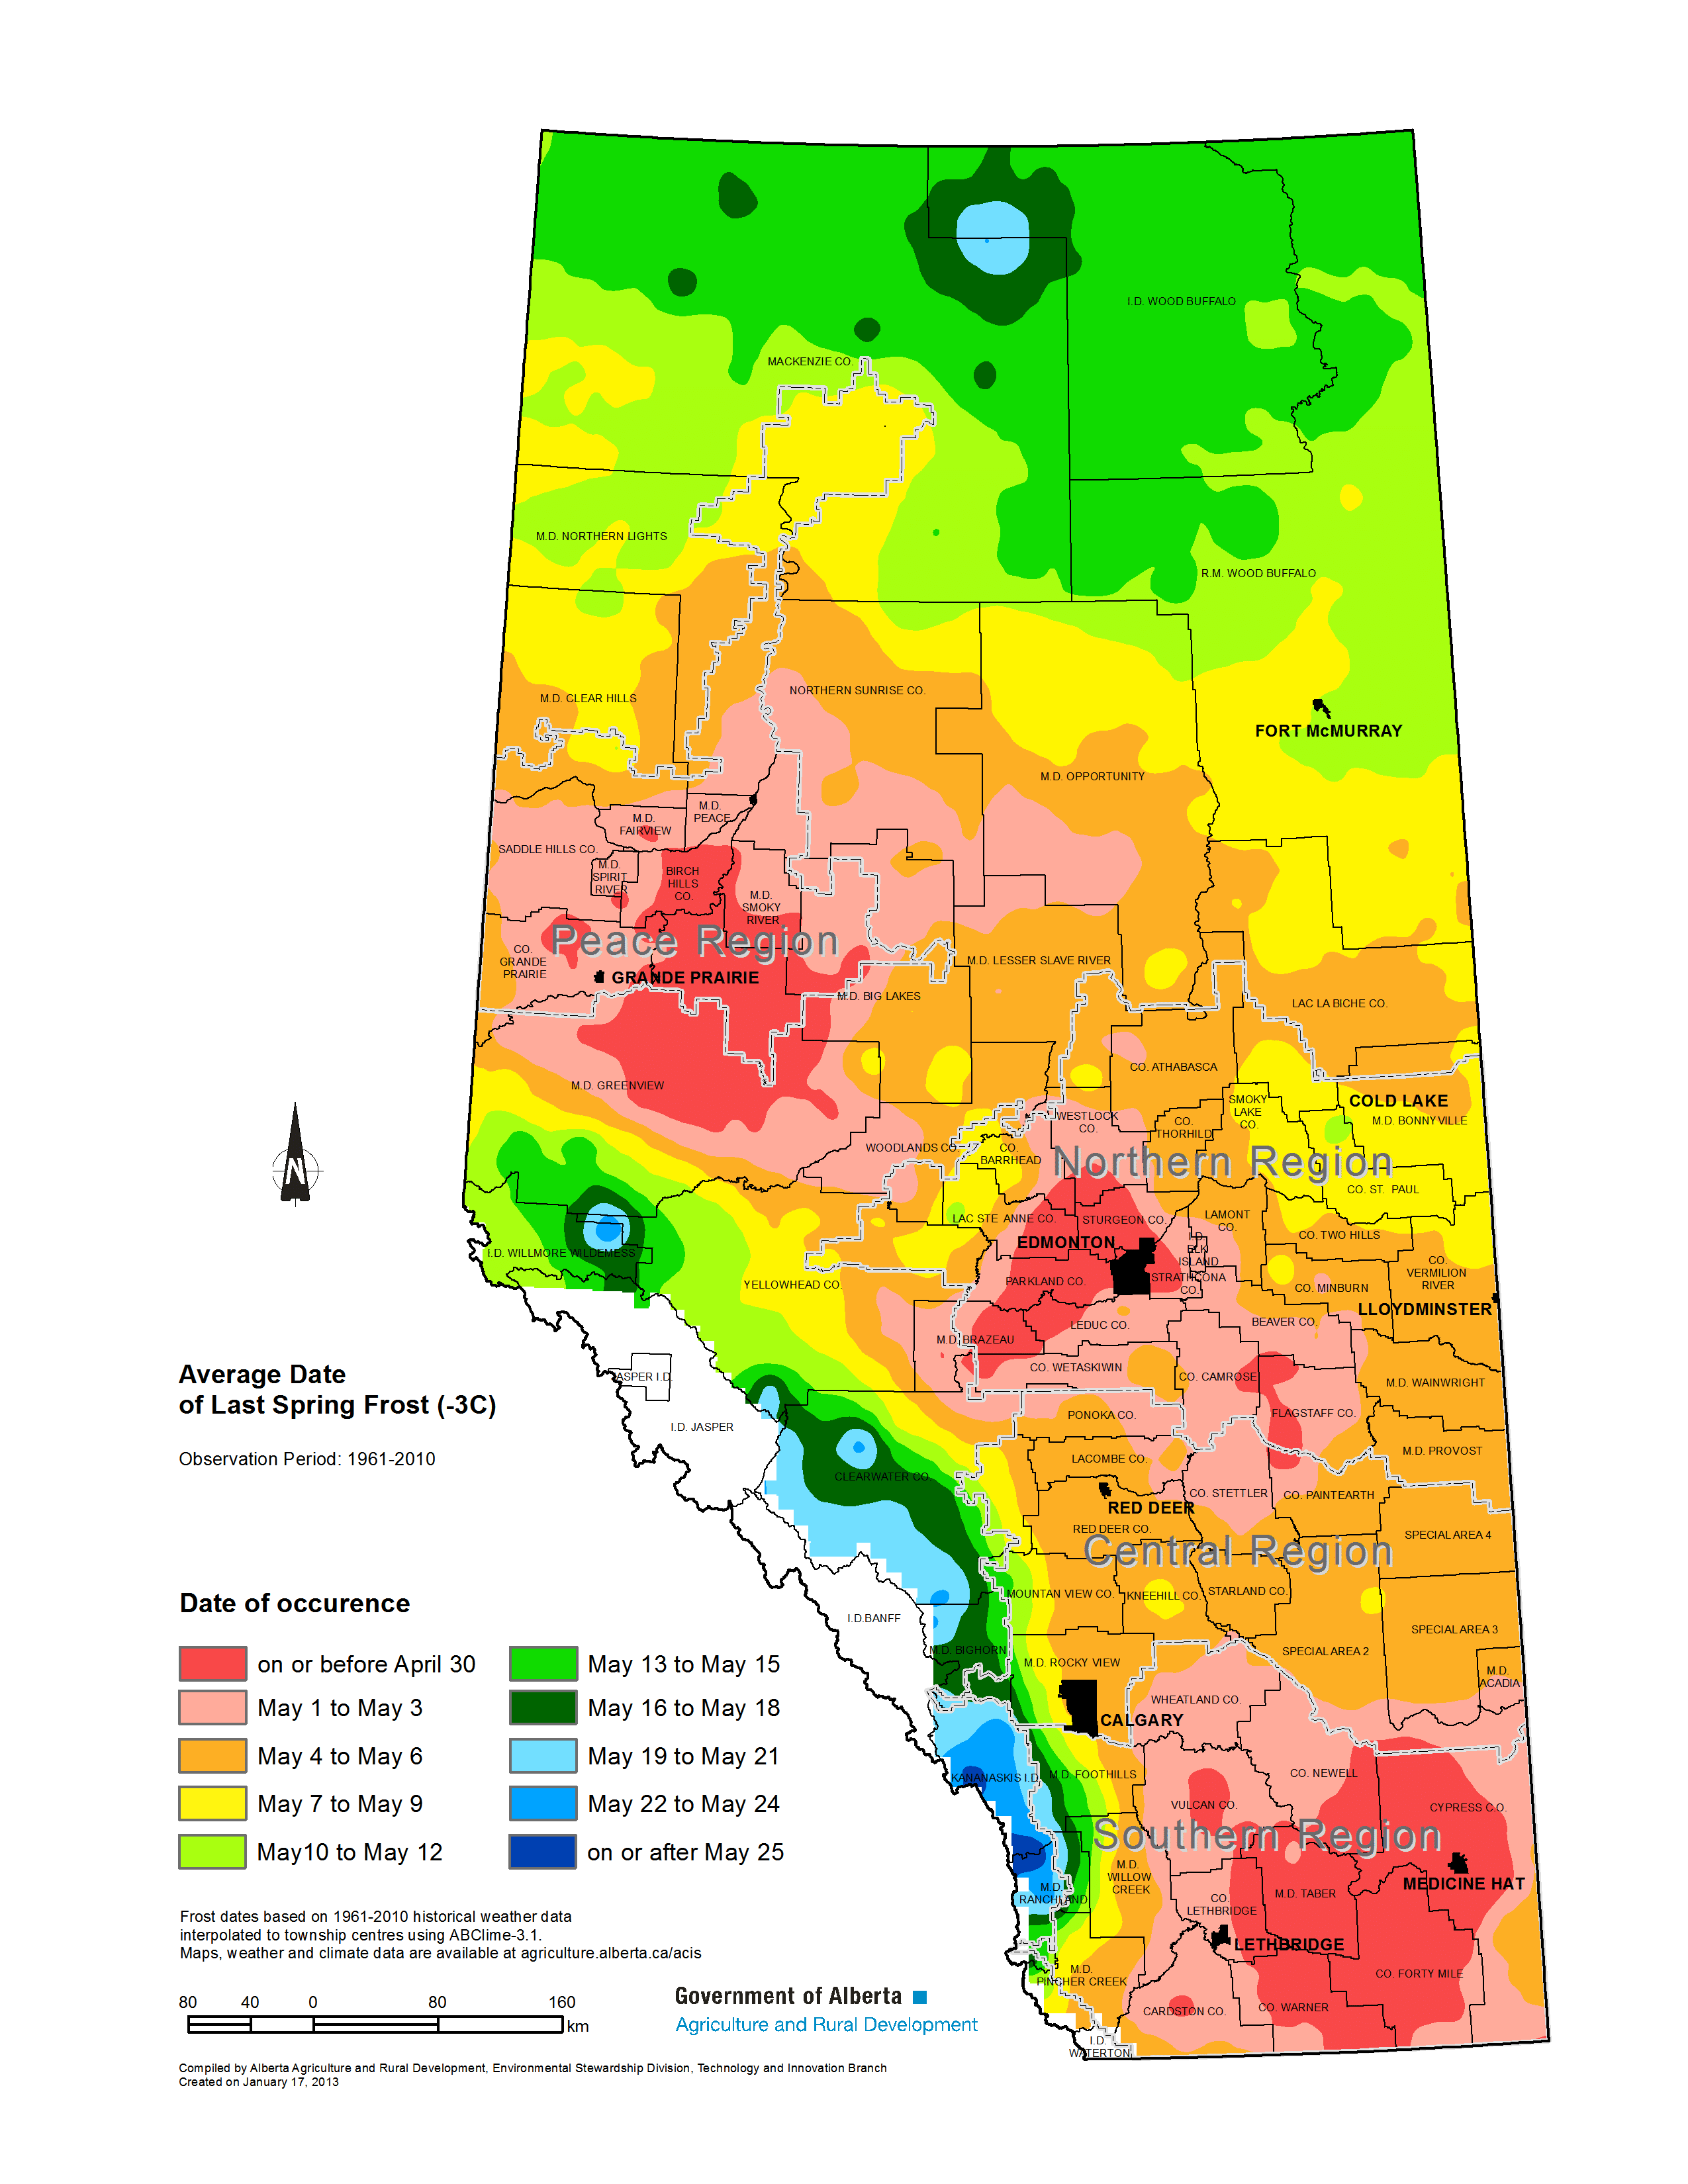
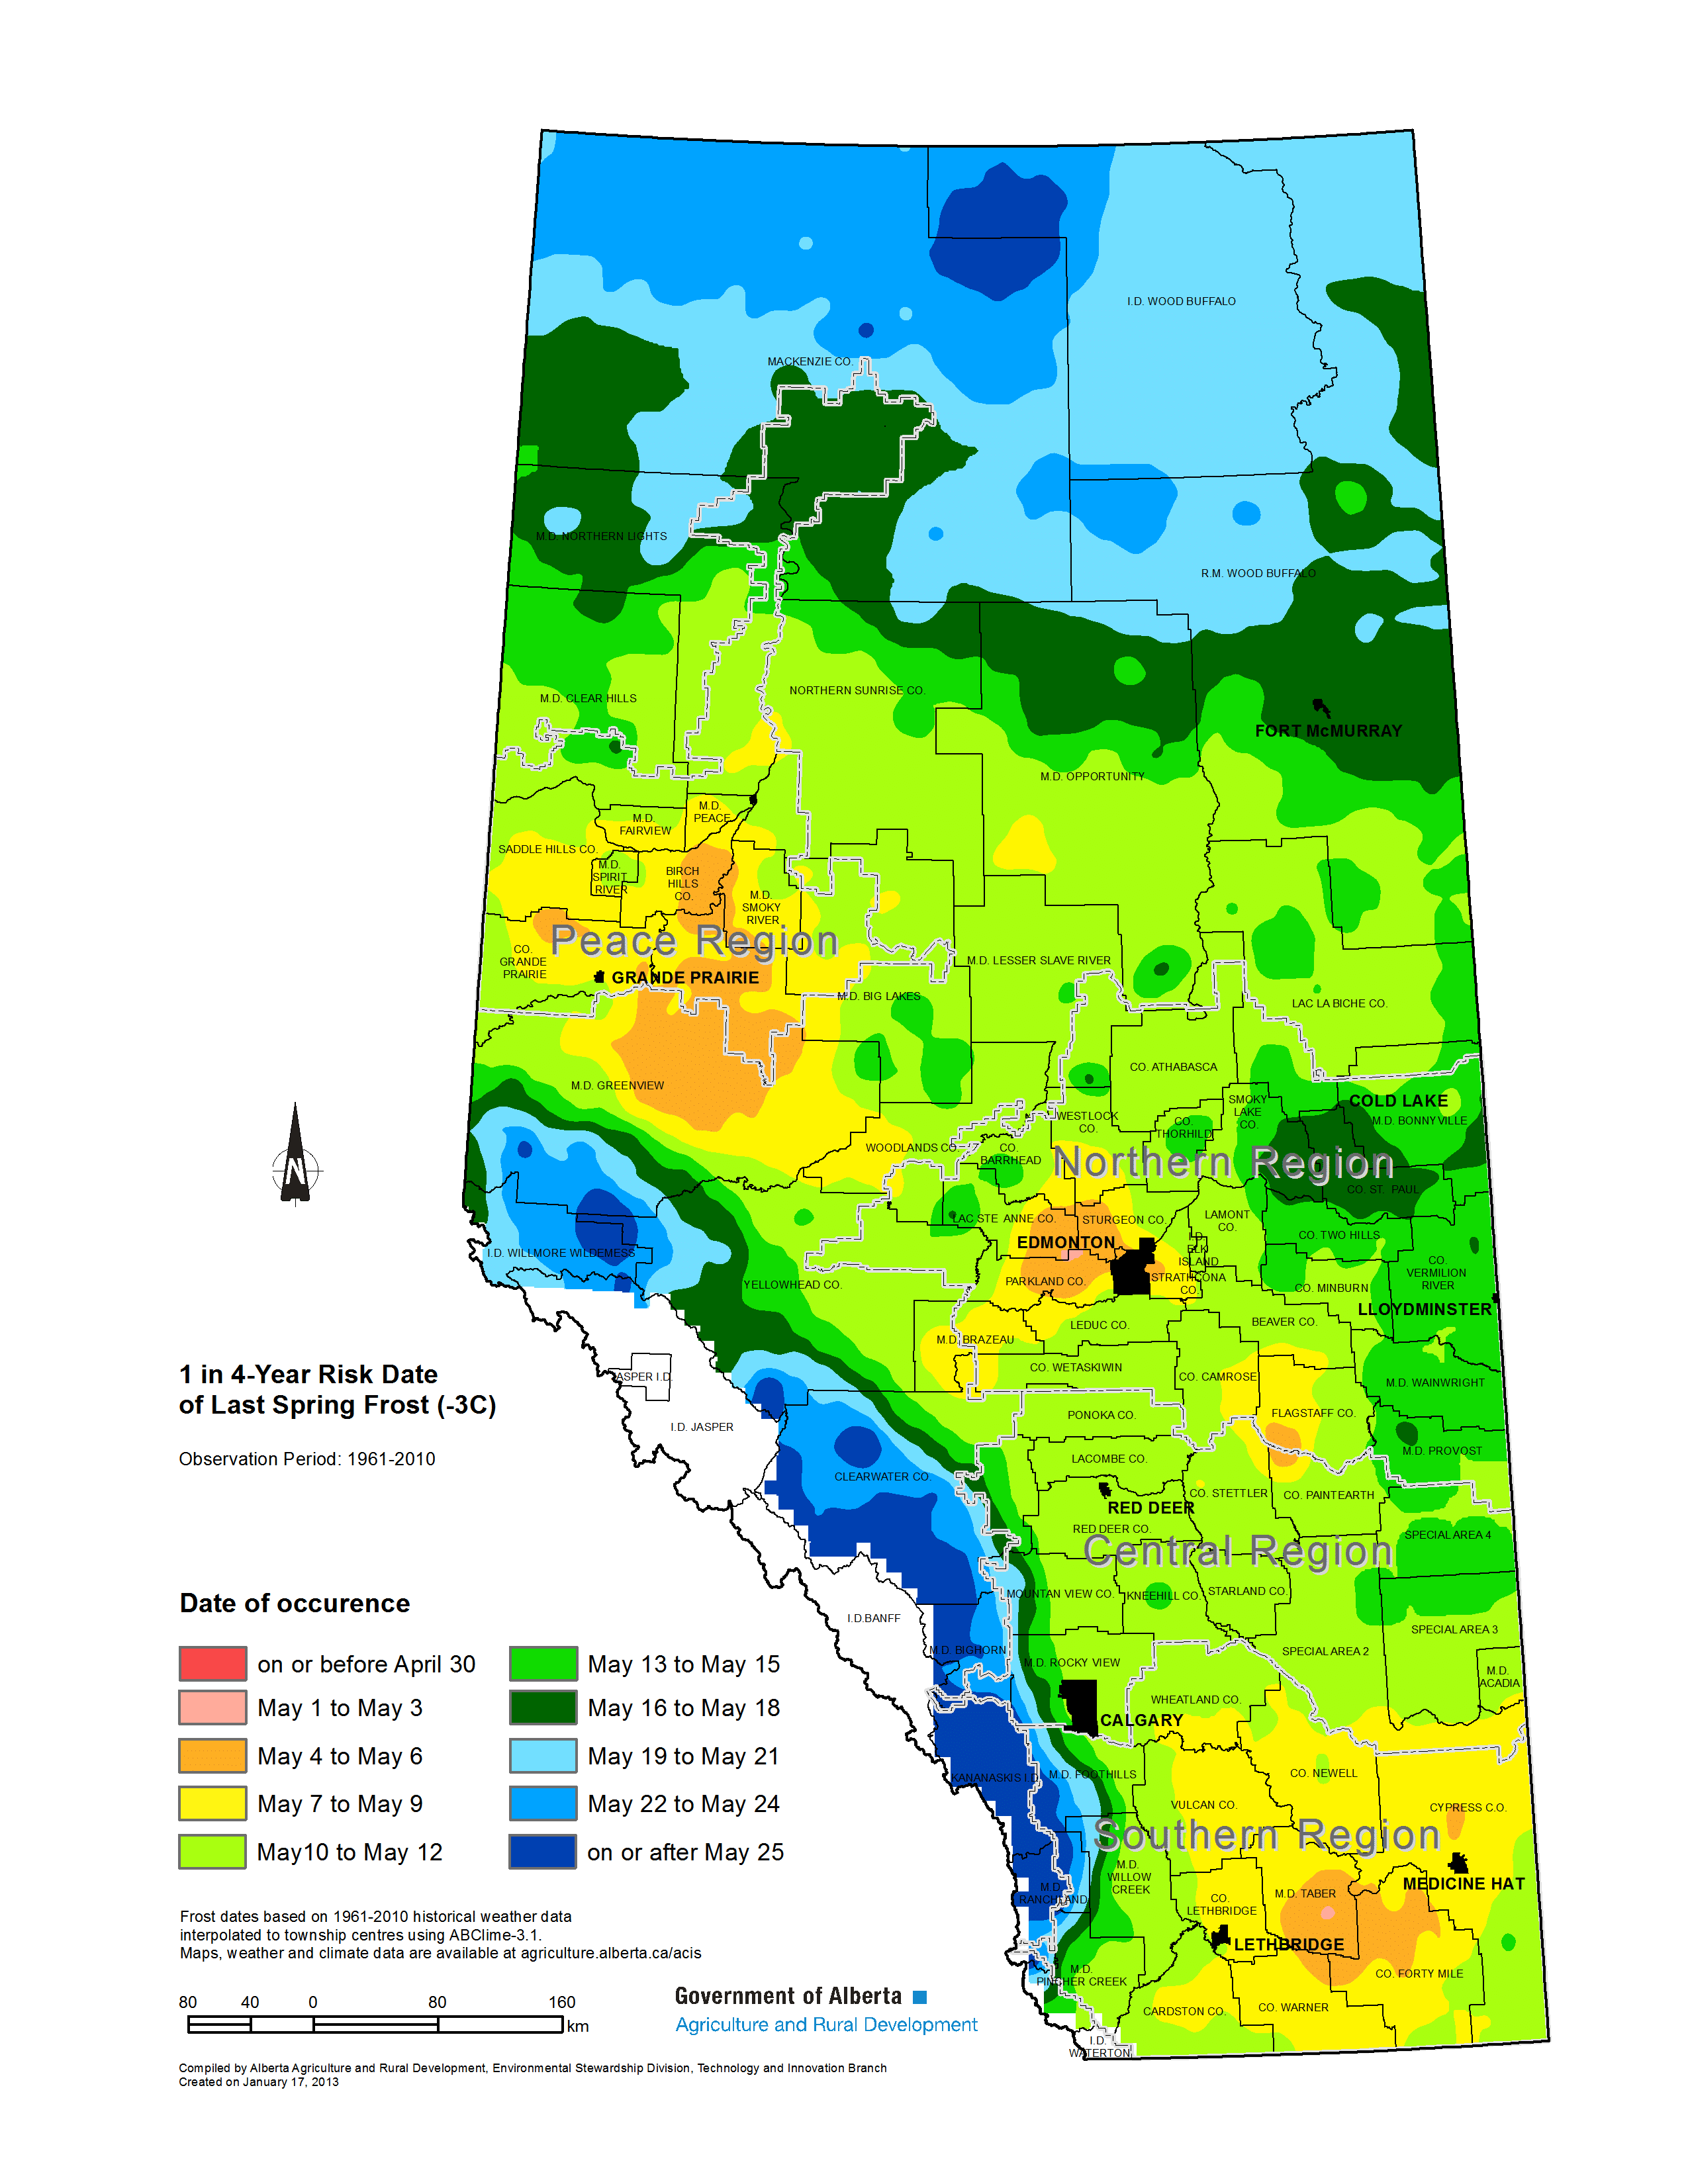
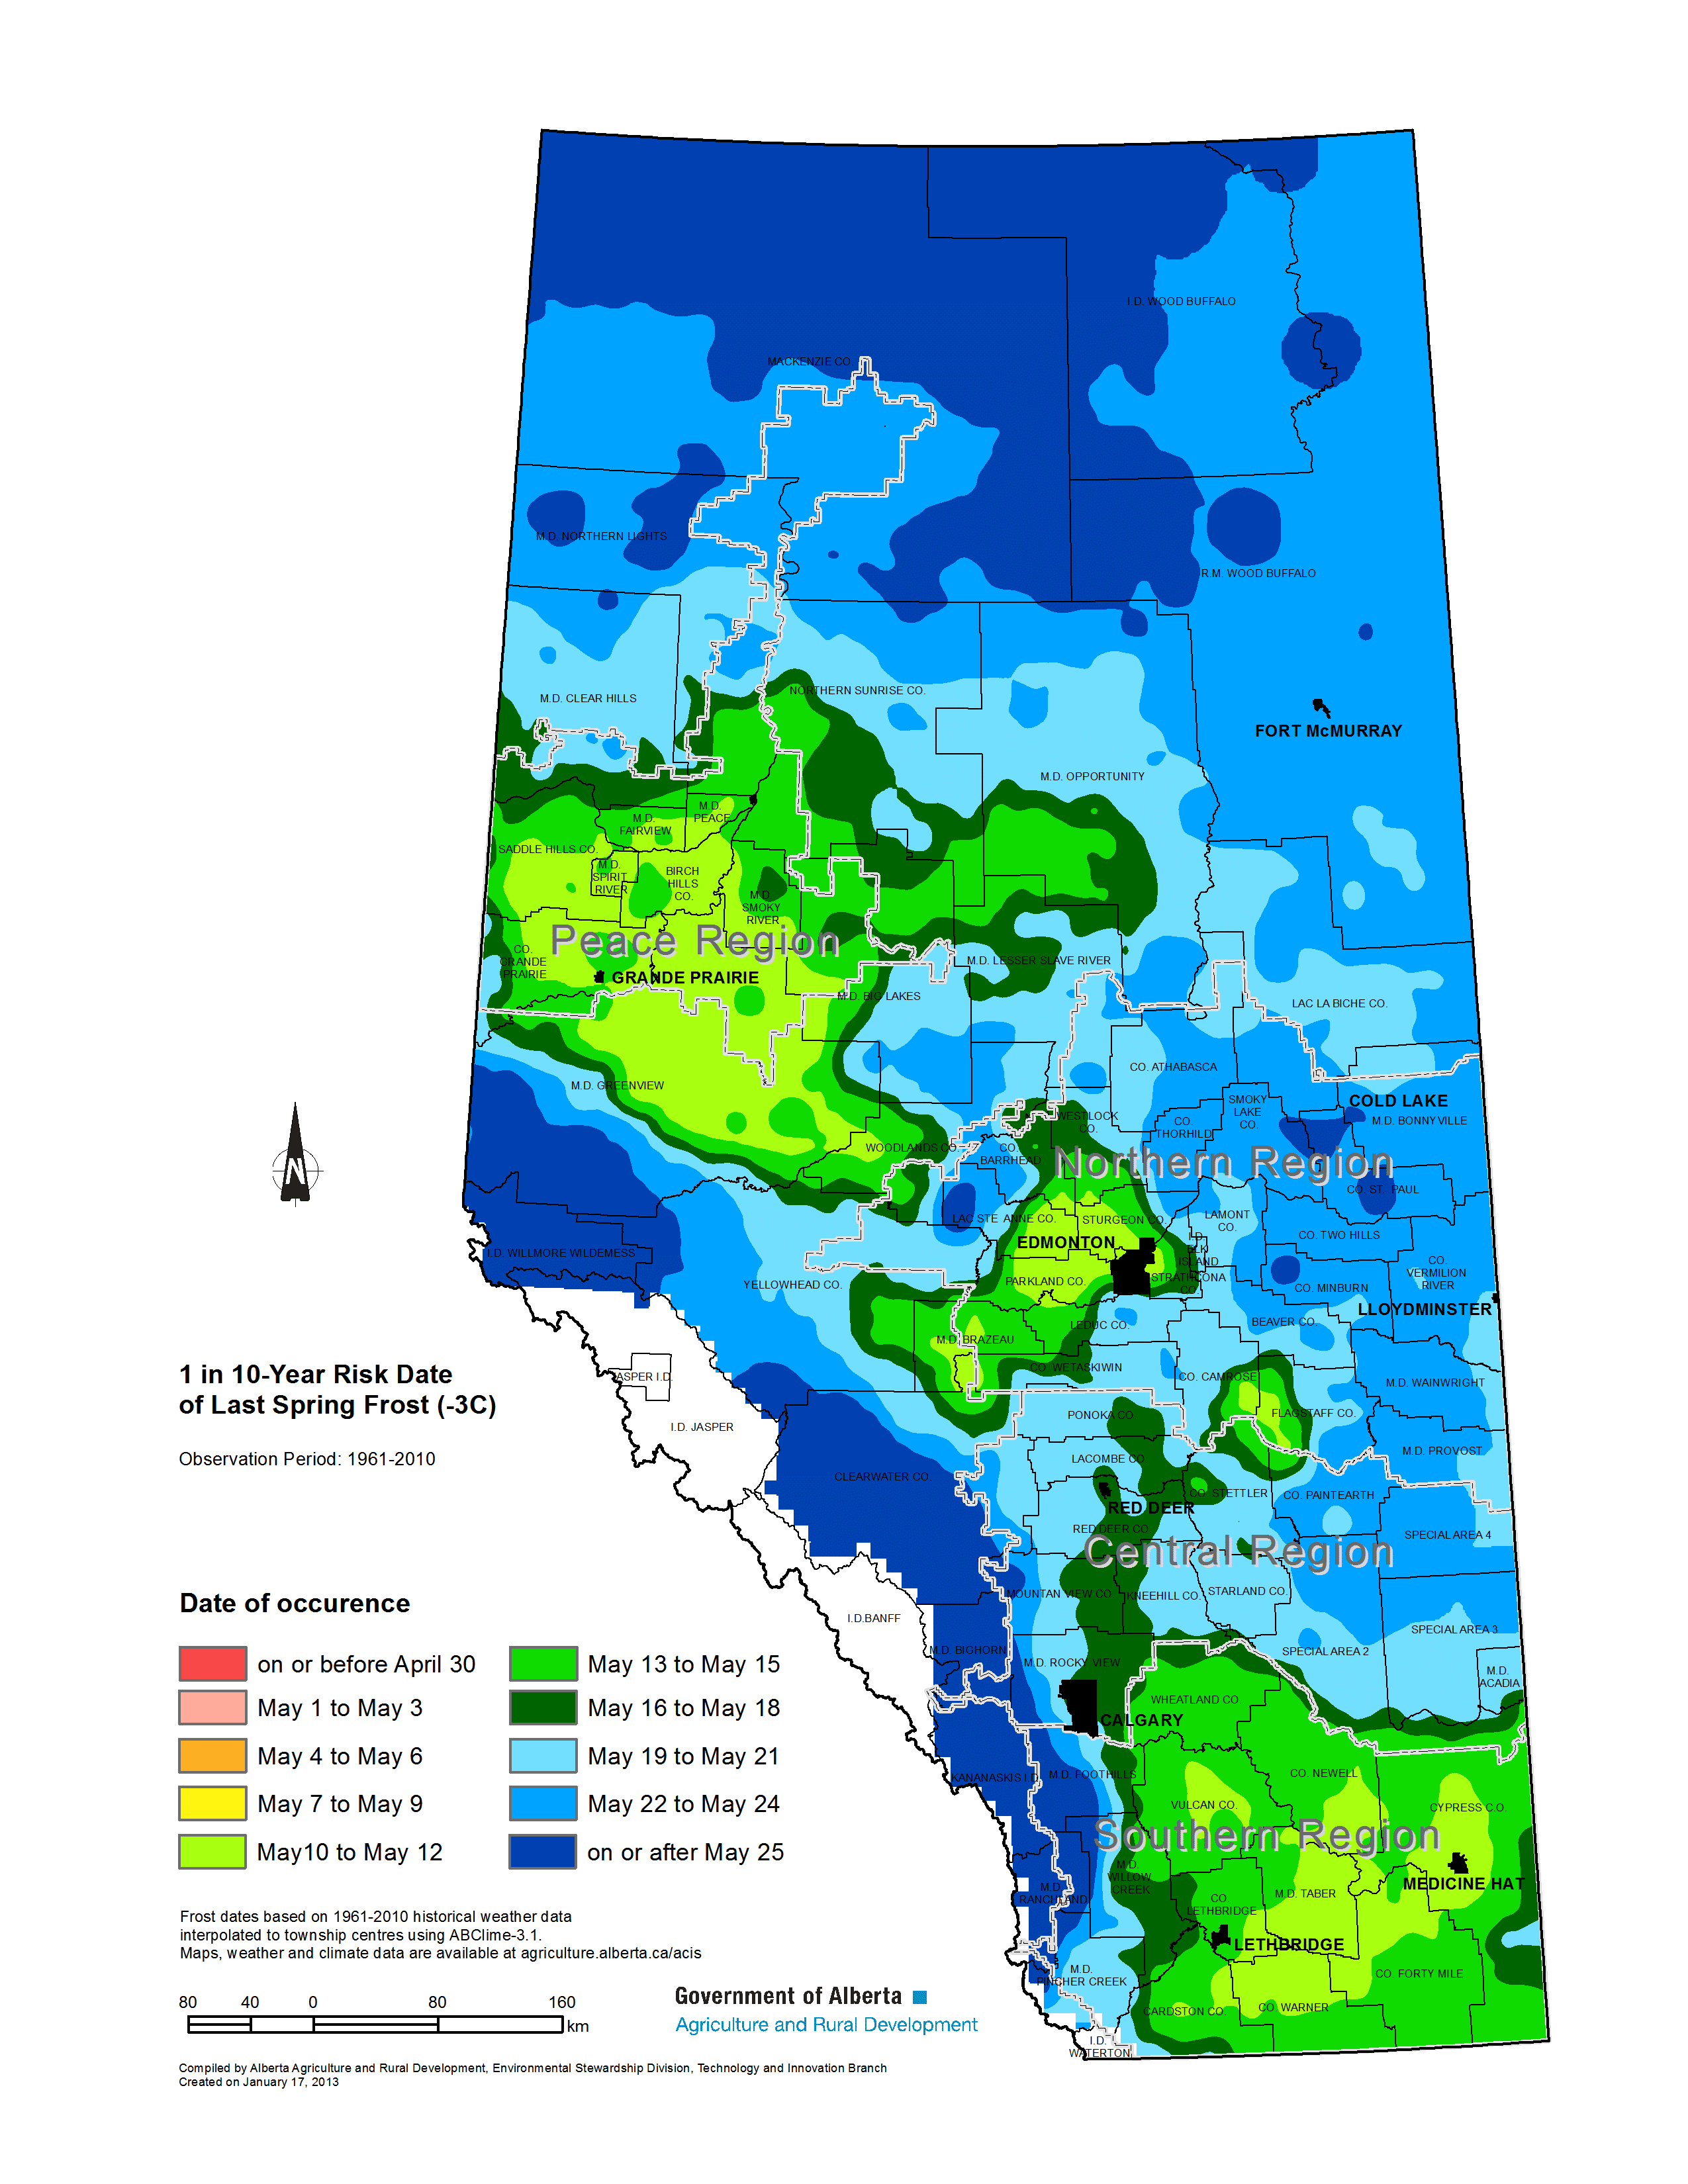
Ralph Wright, who leads the agro-meteorology division with Alberta Agriculture and Forestry, joins Canola Council of Canada agronomy specialist Autumn Barnes and host Jay Whetter in a discussion about frost risk and canola seeding dates. While the discussion focuses on Southern Alberta, growers and agronomists in all regions will learn from the discussion about frost data and probabilities. Here is a link to the weatherdata.ca site Ralph mentions in the podcast. Below are some frost date graphs for various regions across the Prairies.

Here is the -3°C frost risk for Lethbridge, based on historical records. Around May 3, there is a 50% probability (yellow) of a -3 frost. By May 10, that drops to 25% (blue) and by around May 14, the probability of a -3 frost is 10% (green). CLICK TO ENLARGE

Here is the -3°C frost risk for Lacombe, based on historical records. Around May 4, there is a 50% probability (yellow) of a -3 frost. By May 12, that drops to 25% (blue) and by May 20, the probability of a -3 frost crosses the 10% threshold (green). CLICK TO ENLARGE

To get a graph for other Alberta regions, go to the Weather Station Data Viewer at weatherdata.ca, then take these steps:

—Select the Normals tab (left of the map, at the top)
—Click station of interest on the map
—Select “frost probability -3°C” or another option in check boxes
—Select date range. Late April to late May dates would be suitable.
—Then choose to graph, view or download the data
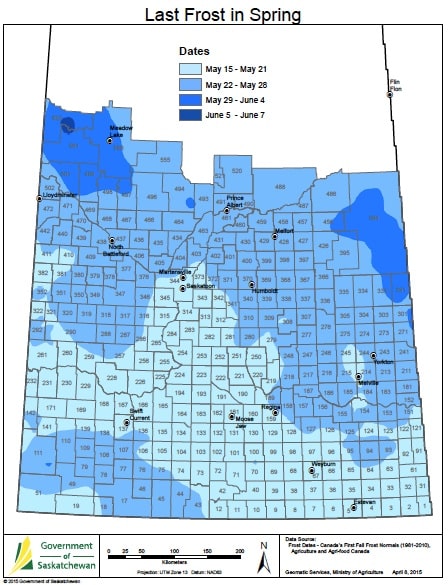
This map shows the average date of the last -3°C frost in Alberta. That means one year in 2, or 50% of the time, a -3°C frost will occur on or after that date.

One year in four (25% probability) the last -3°C frost in Alberta will occur on or after these dates. Seeding based on these dates is lower risk that seeding based on the average last frost date.

One year in 10 (10% probability) the last -3°C frost in Alberta will occur on or after these dates.

Saskatchewan

Last spring frost Saskatchewan

Manitoba

Manitoba spring frost risk map

Manitoba has more agroclimate maps here.